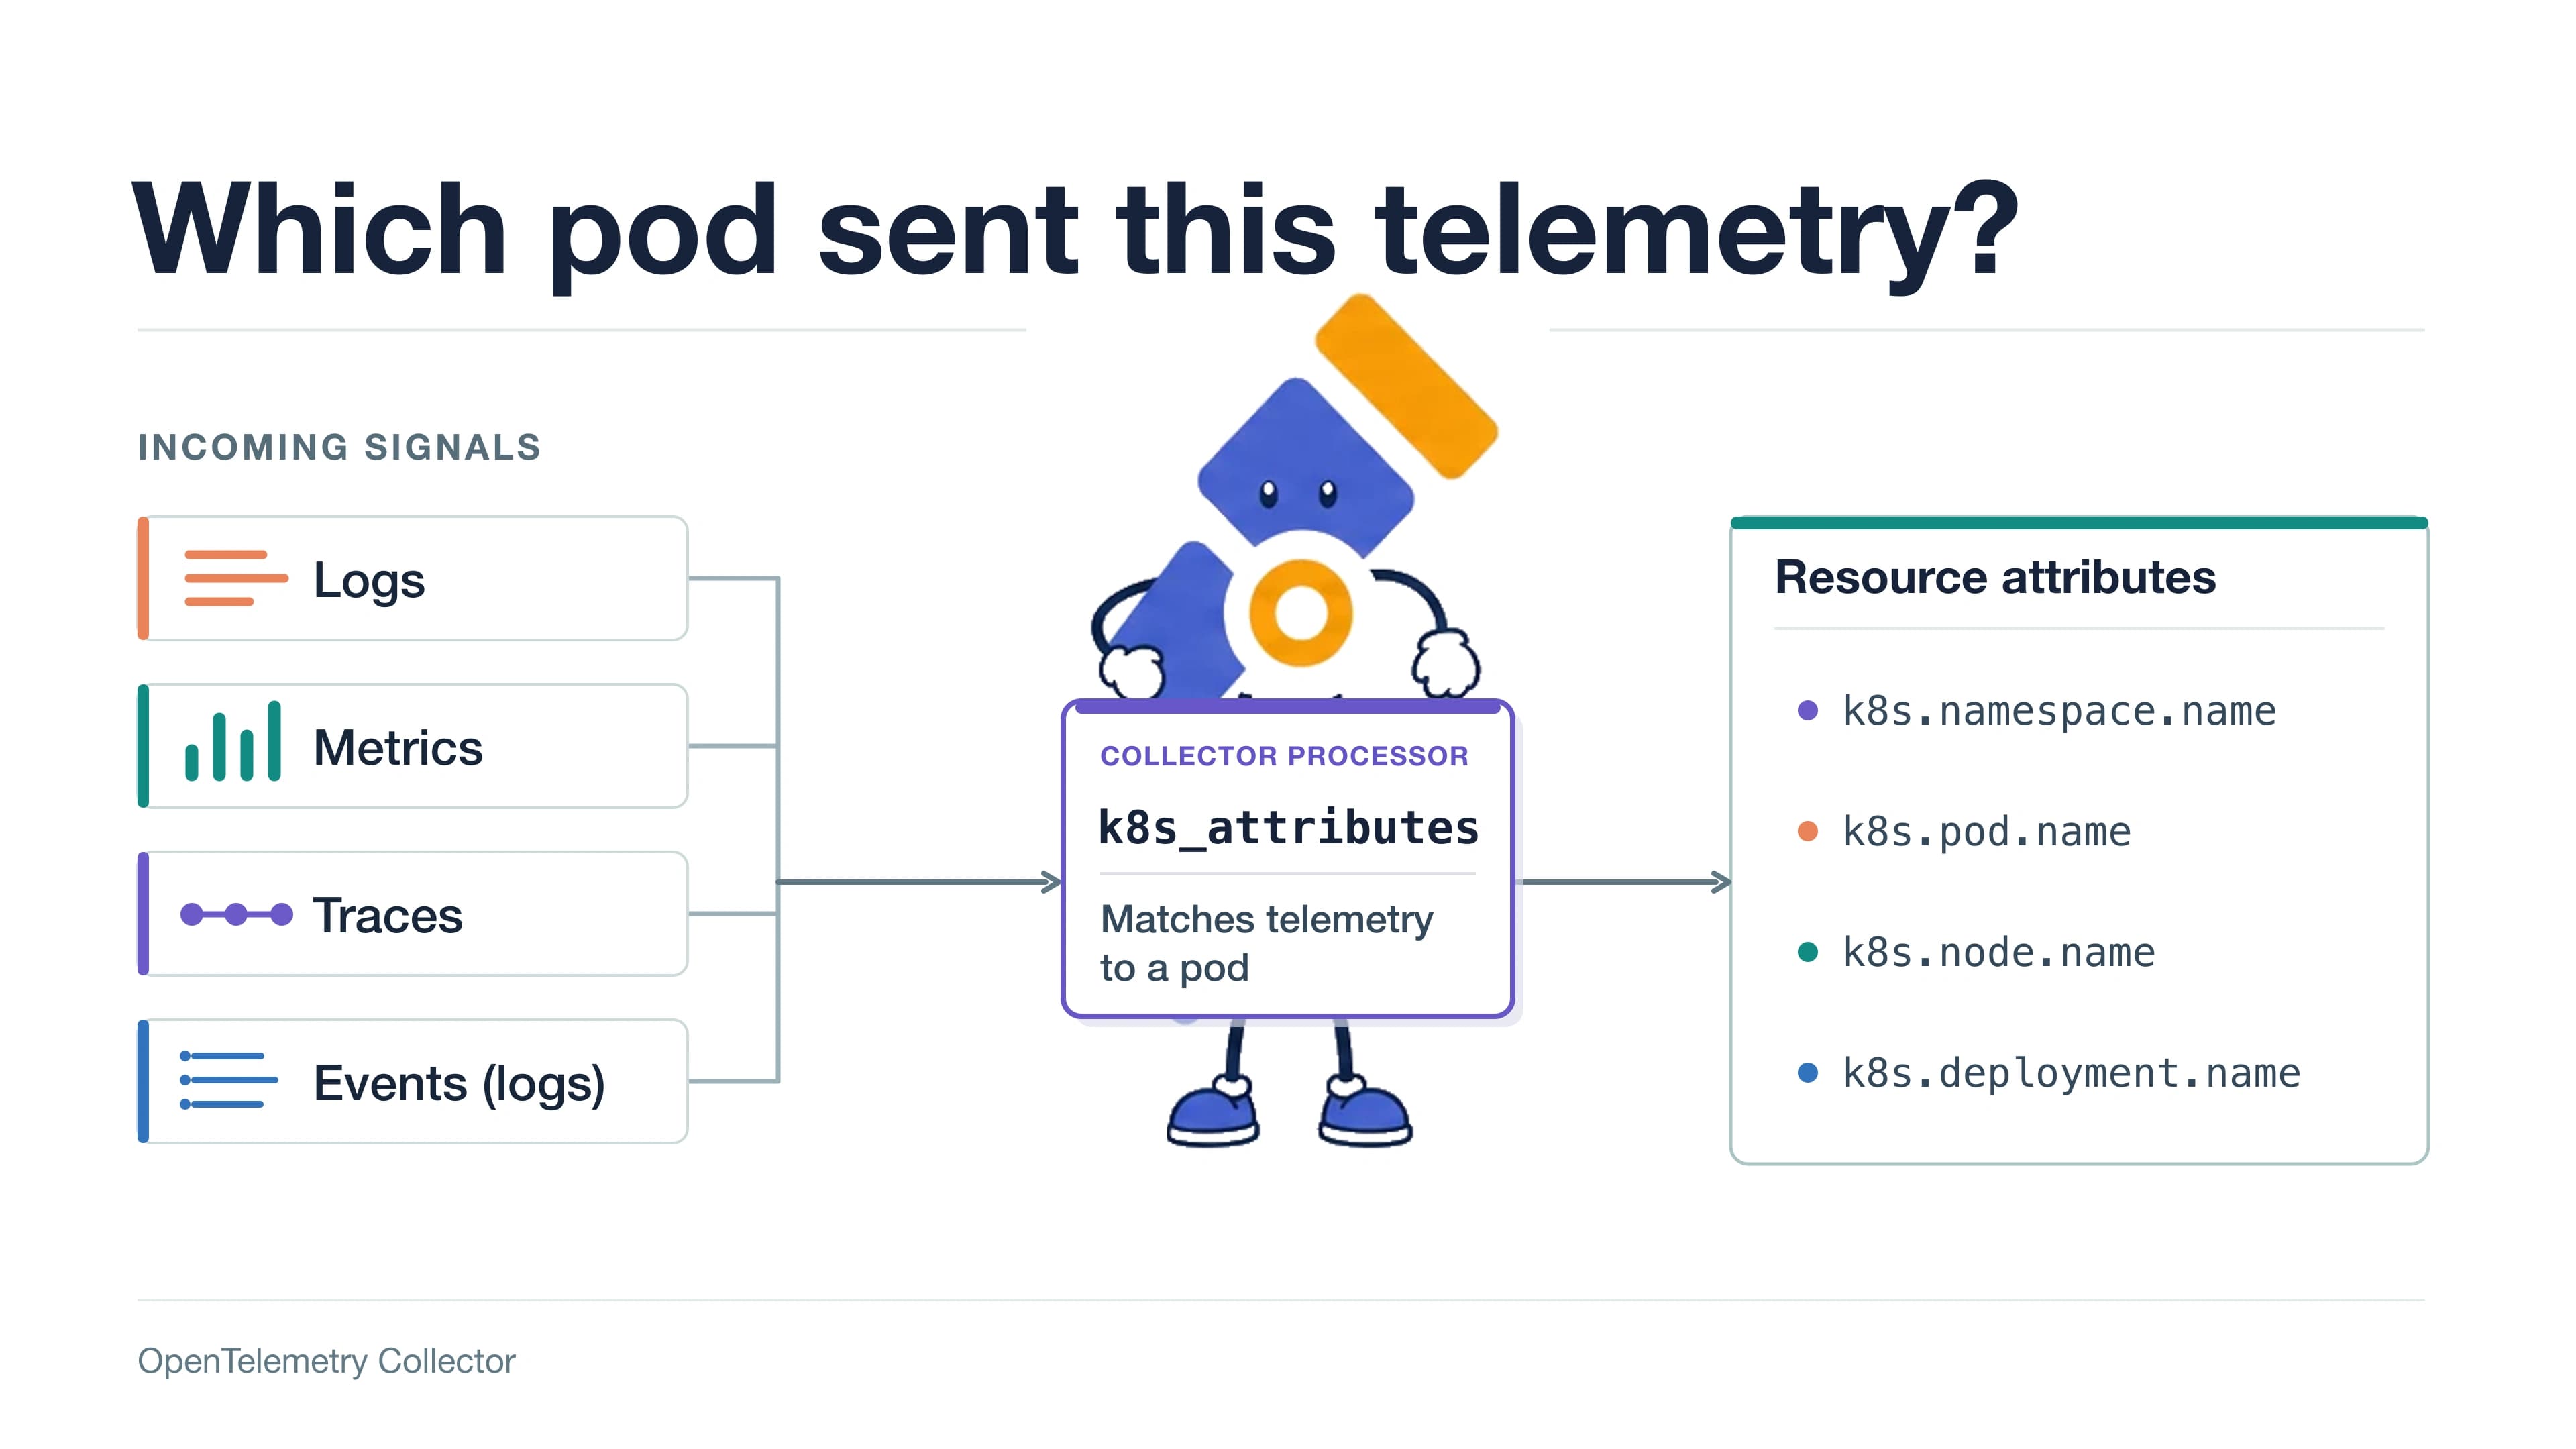
Which Kubernetes object produced this telemetry? In Kubernetes, that question stops being academic the minute the page fires. A trace says checkout slowed down. A log says connection refused. A metric says CPU spiked. None of it is enough on its own. The signal has to land on a real pod, in a real namespace, on a real node, owned by a real workload. Without that join, observability turns into decorated exhaust: lots of data, not enough answers.
The k8sattributesprocessor, i.e. the Kubernetes attributes processor, is the Collector component that makes that join happen. It watches Kubernetes metadata, keeps a local view of pods and related resources, matches each incoming signal to the pod that produced it, and writes the result as OpenTelemetry resource attributes. The processor is simple in name and sharp in production: if the Collector still has a trustworthy pod identifier, telemetry becomes queryable by the shape of the cluster; if it does not, the rest of the pipeline is guessing. See the OpenTelemetry Collector guide for the full receiver-processor-exporter pipeline.
What the Kubernetes attributes processor does
The processor adds k8s context to telemetry that is already moving through the Collector. It does not collect pod logs by itself, scrape kubelet metrics, or create spans. A log, metric or span arrives with whatever resource attributes the source already sent. The processor looks for the pod that produced it, then adds fields such as namespace, pod name, pod UID, node name and workload metadata before the data leaves the pipeline.
In config, define k8s_attributes under processors and include it in the pipeline that should be enriched. Older examples may still use k8sattributes; current Collector Contrib keeps that as a deprecated type alias. Check the component's current status and supported distributions before copying a config into production, because Contrib and k8s Collector distributions include the processor, while a minimal custom Collector only has it if the build includes the component.
Once it is active in a pipeline, the work happens in two parts:
- Build a local cache of k8s metadata.
- Use that cache to add resource attributes to telemetry.
At startup, unless passthrough mode is enabled, the processor creates k8s clients and starts informers. The pod informer is the main one, but the processor may also watch namespaces, nodes, ReplicaSets, Deployments, StatefulSets, DaemonSets, Jobs or CronJobs depending on the configured extraction rules. As k8s sends add, update and delete events, the processor keeps lookup maps in memory. A pod may be indexed by identifiers such as pod IP, pod UID, container ID or attributes used in pod_association rules.
When telemetry passes through the processor, the processor tries to find the matching pod from that cache. If it finds one, it adds configured metadata to the resource attributes and leaves the signal itself moving through the pipeline. That means logs, metrics and traces all benefit from the same resource-level context. A resource that arrived like this:
{
  "resource": {
    "attributes": {
      "service.name": "checkout-api"
    }
  }
}
might leave the processor like this:
{
  "resource": {
    "attributes": {
      "service.name": "checkout-api",
      "k8s.namespace.name": "payments",
      "k8s.pod.name": "checkout-api-7b9f9554f8-q9vnr",
      "k8s.pod.uid": "d30d0a5e-4c3d-4e25-8a74-3b95c04b620a",
      "k8s.deployment.name": "checkout-api",
      "k8s.node.name": "ip-10-0-42-18"
    }
  }
}
The processor earns its keep when queries stop being service-only and start being cluster-aware. We get pod, namespace, node and workload context without asking every application team to add the same fields by hand. The application keeps emitting telemetry. The Collector adds the cluster context at the point where it can still make a correct join.
How pod association matches telemetry to Kubernetes pods
The processor cannot add correct metadata until it knows which pod produced the telemetry. This matching step is called pod association. The rest of the processor is mostly bookkeeping. The association rule is where correctness is won or lost. A pod association rule tells the processor where to look for an identifier, and that identifier is then used against the local pod cache. There are two source types:
connection: use the IP address from the incoming connection context.resource_attribute: use a named resource attribute such ask8s.pod.ip,k8s.pod.uid,k8s.pod.nameork8s.namespace.name.
Rules are checked in order, and the first rule whose sources can be read is used. If a rule has multiple sources, all of them must be present, so k8s.pod.name plus k8s.namespace.name behaves like a compound key. The processor allows up to four sources in one association rule, and duplicate associations are rejected during configuration validation. This gives us room to try strong identifiers first and weaker fallbacks later.
The rules do not always fall through. If a higher-priority source attribute is present but its value does not match a pod in the processor's cache, association fails and later rules are not evaluated. Later rules are fallbacks for unavailable sources, not for stale or incorrect identifiers. Put the strongest reliable identifier first, and make sure upstream instrumentation does not attach an outdated pod UID or IP address.
Here is the association block:
processors:
  k8s_attributes:
    pod_association:
      - sources:
          - from: resource_attribute
            name: k8s.pod.uid
      - sources:
          - from: resource_attribute
            name: k8s.pod.name
          - from: resource_attribute
            name: k8s.namespace.name
      - sources:
          - from: connection
Read that as:
- If the telemetry already has
k8s.pod.uid, match by UID. - Otherwise, if it has pod name and namespace, use that pair.
- Otherwise, fall back to the incoming connection IP.
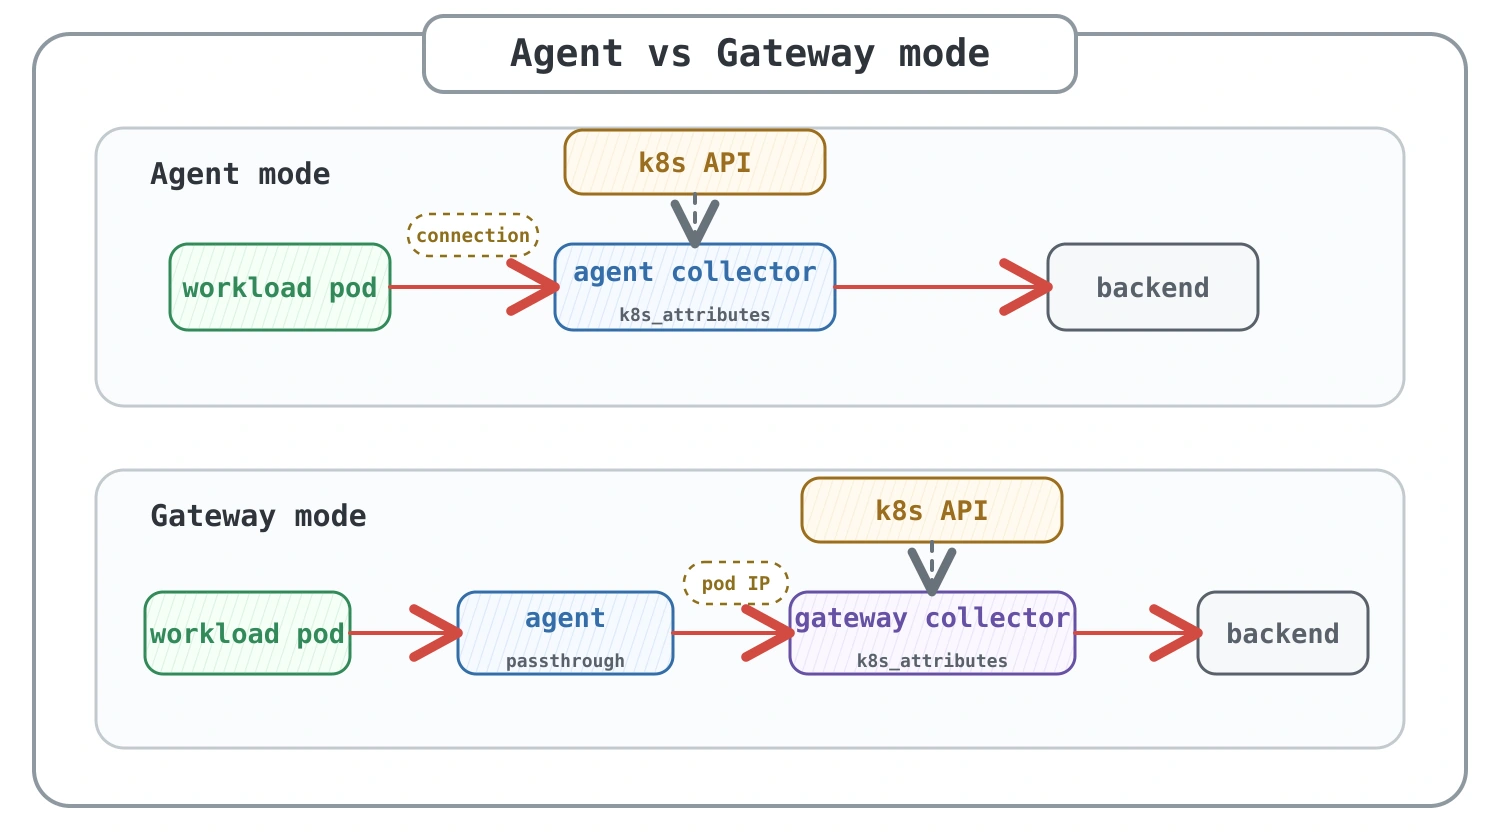
Do not match by k8s.pod.name alone. Pod names are unique inside a namespace, not across the whole cluster, so a pod name plus namespace is a safer fallback and a pod UID is better when it exists on the resource. If pod_association is omitted, the processor associates telemetry using only the incoming connection IP. Configure explicit resource_attribute rules when the pod IP, pod UID, or pod name and namespace already exist on the resource. Connection-based association is fine for simple agent deployments, but it is often wrong for gateways because gateways usually see traffic after another hop has already rewritten what "source" means.
Agent mode: the simple and common case
In k8s, an agent Collector usually runs as a DaemonSet, with one Collector pod on each node. Workloads on that node send telemetry to the local agent, or the agent reads local logs and metrics from node-local sources. This is where connection association works best, because the Collector receives data close to the workload and the incoming connection can still point at the application pod. Use a node filter in this mode. Without a filter, each agent may watch pods beyond its own node, which increases memory use and k8s API watch work without improving enrichment quality.
processors:
  k8s_attributes:
    auth_type: serviceAccount
    filter:
      node_from_env_var: KUBE_NODE_NAME
    extract:
      metadata:
        - k8s.namespace.name
        - k8s.pod.name
        - k8s.pod.uid
        - k8s.pod.start_time
        - k8s.deployment.name
        - k8s.node.name
      labels:
        - tag_name: team
          key: team
          from: pod
        - tag_name: app_component
          key: app.kubernetes.io/component
          from: pod
    pod_association:
      - sources:
          - from: connection
The KUBE_NODE_NAME environment variable normally comes from the Kubernetes downward API:
env:
  - name: KUBE_NODE_NAME
    valueFrom:
      fieldRef:
        fieldPath: spec.nodeName
Put the processor before batch when using connection association. Batching and tail sampling can remove the original connection context, and once that context is gone, the processor cannot use it to find the pod. This is one of those Collector ordering details that looks small in YAML but changes the behavior of the whole pipeline.
service:
  pipelines:
    logs:
      receivers: [otlp]
      processors: [k8s_attributes, batch]
      exporters: [otlphttp/backend]
That order is not decoration. It is part of the matching logic, and it is a good reason to think about this processor as early enrichment rather than a late formatting step.
Gateway mode: do not trust the connection IP
A gateway Collector runs as a shared Deployment or StatefulSet. Applications or node agents send telemetry to a k8s Service in front of the gateway, which means the gateway often sees the source as an agent, proxy or network hop instead of the original application pod. If the gateway uses connection, it may enrich telemetry with the wrong pod or fail to match anything useful. The common fix is a two-layer setup where the agent preserves pod identity and the gateway does the full metadata lookup.
The agent runs k8s_attributes in passthrough mode. In passthrough mode, it detects the pod IP and adds it to resource attributes. It does not call the k8s API, does not watch pods and does not extract the rest of the metadata. The gateway then uses that pod IP as a resource attribute and performs the full k8s metadata lookup.
Agent:
processors:
  k8s_attributes:
    passthrough: true

service:
  pipelines:
    traces:
      receivers: [otlp]
      processors: [k8s_attributes, batch]
      exporters: [otlp/gateway]
Gateway:
processors:
  k8s_attributes:
    auth_type: serviceAccount
    extract:
      metadata:
        - k8s.namespace.name
        - k8s.pod.name
        - k8s.pod.uid
        - k8s.deployment.name
        - k8s.node.name
      labels:
        - tag_name: team
          key: team
          from: pod
    pod_association:
      - sources:
          - from: resource_attribute
            name: k8s.pod.ip
This split keeps k8s API access in the gateway while still giving the gateway a reliable pod identifier. Passthrough is not necessary when applications or agents already attach stable k8s resource attributes such as k8s.pod.uid, k8s.pod.ip, or k8s.pod.name plus k8s.namespace.name. The important point is not the exact layer where enrichment happens; it is that the layer doing enrichment must have a trustworthy pod identifier.
Kubernetes metadata worth extracting
Start with the attributes that explain ownership and blast radius: namespace, pod, pod UID, pod start time, Deployment and node. Those fields answer the first questions during a rollout, a noisy pod, a node-level issue or a sudden burst of logs from one workload.
k8s.namespace.name, k8s.pod.name, k8s.pod.uid, k8s.pod.start_time, k8s.deployment.name, k8s.node.name
The extraction list can go further: k8s.namespace.name, k8s.pod.name, k8s.pod.uid, k8s.pod.ip, k8s.replicaset.name, k8s.deployment.name, k8s.statefulset.name, k8s.daemonset.name, k8s.job.name, k8s.cronjob.name, k8s.node.name, k8s.cluster.uid, service.name, service.namespace, service.version, service.instance.id.
Not every configured field is guaranteed to appear on every resource. A pod managed by a Deployment can get k8s.deployment.name, while a standalone pod cannot. Container image attributes need enough container identity to pick the right container, especially in multi-container pods. For multi-container pods, send at least one of these resource attributes when container-level metadata is needed:
container.idk8s.container.name
If a pod has only one container, the processor can often infer the container. In multi-container pods, guessing is unsafe because the same pod can contain sidecars, init containers or application containers with different image and runtime identity. Give the processor a container identifier when container-level enrichment is required.
Labels and annotations are where the processor becomes useful
The standard k8s fields are helpful, but Kubernetes labels and annotations are where the data starts matching how our organizations work. Most teams already encode ownership, environment, app component, version or deployment metadata in k8s labels. The processor can promote those values into OpenTelemetry resource attributes, which makes them available in logs, metrics and traces without changing application code.
For example:
extract:
  labels:
    - tag_name: team
      key: team
      from: pod
    - tag_name: environment
      key: environment
      from: namespace
    - tag_name: service_component
      key: app.kubernetes.io/component
      from: pod
  annotations:
    - tag_name: git_commit
      key: git-commit
      from: pod
This turns k8s metadata into queryable resource attributes:
team=paymentsenvironment=productionservice_component=apigit_commit=9f4c2a7
Labels and annotations can come from pods, namespaces, nodes and workload resources such as Deployments, ReplicaSets, StatefulSets, DaemonSets, Jobs and CronJobs. Every extra source expands the watch set, the RBAC surface and the number of attributes that may end up indexed. Extracting every label with a broad regex can also create high-cardinality attributes. A label like pod-template-hash or a changing build ID may help during debugging, but it gets expensive if we index it everywhere.
Prefer a short allowlist:
extract:
  labels:
    - tag_name: team
      key: team
      from: pod
    - tag_name: tier
      key: app.kubernetes.io/component
      from: pod
Use key_regex when the label namespace is owned and the cardinality is understood:
extract:
  labels:
    - tag_name: app_$1
      key_regex: app\.example\.com/(.+)
      from: pod
Avoid this unless there is a specific reason:
extract:
  labels:
    - tag_name: $1
      key_regex: (.*)
      from: pod
That says "copy everything". In a large cluster, "everything" becomes a bill, a noisy schema and a harder query experience. A better default is to treat label extraction like index design: add the fields we expect people to query, alert on or route by, and leave the rest in k8s.
OpenTelemetry resource annotations
The processor also supports otel_annotations. When enabled, pod annotations with the prefix resource.opentelemetry.io/ become resource attributes. This is useful when platform teams want a k8s-native way to set OpenTelemetry resource attributes without changing application code or asking every service owner to rebuild instrumentation. For example:
metadata:
  annotations:
    resource.opentelemetry.io/service.version: "2026.09.27"
    resource.opentelemetry.io/deployment.environment.name: "production"
With:
extract:
  otel_annotations: true
the resource can receive:
service.version = 2026.09.27
deployment.environment.name = production
This is a good boundary: workload manifests carry the intent, the Collector turns that intent into resource attributes, and the backend only sees normal OTLP fields. The source can be code, deployment metadata or the Collector, but the query path stays the same.
RBAC: start narrow, then match what we extract
With auth_type: serviceAccount, the Collector uses the pod's k8s service account. That service account needs Kubernetes RBAC permission to read the resources the processor watches. For basic pod enrichment across the cluster, the usual permissions are get, list and watch on pods and namespaces. Reading node metadata means adding nodes. Extracting labels or annotations from Deployments, ReplicaSets, Jobs or CronJobs means adding those resources too. The RBAC should follow the extraction config, not the other way around.
A cluster-scoped setup often starts like this:
apiVersion: v1
kind: ServiceAccount
metadata:
  name: otel-collector
  namespace: observability
---
apiVersion: rbac.authorization.k8s.io/v1
kind: ClusterRole
metadata:
  name: otel-collector-k8s-attributes
rules:
  - apiGroups: [""]
    resources: ["pods", "namespaces", "nodes"]
    verbs: ["get", "list", "watch"]
  - apiGroups: ["apps"]
    resources: ["replicasets", "deployments", "statefulsets", "daemonsets"]
    verbs: ["get", "list", "watch"]
  - apiGroups: ["batch"]
    resources: ["jobs", "cronjobs"]
    verbs: ["get", "list", "watch"]
---
apiVersion: rbac.authorization.k8s.io/v1
kind: ClusterRoleBinding
metadata:
  name: otel-collector-k8s-attributes
subjects:
  - kind: ServiceAccount
    name: otel-collector
    namespace: observability
roleRef:
  kind: ClusterRole
  name: otel-collector-k8s-attributes
  apiGroup: rbac.authorization.k8s.io
We do not always need all of that. For one workload namespace, configure:
processors:
  k8s_attributes:
    filter:
      namespace: payments
Then use a namespaced Role and RoleBinding for that namespace. There are trade-offs with namespace-scoped RBAC. Nodes and namespaces are cluster-scoped objects, so a namespaced role cannot read node labels, namespace labels or the k8s.cluster.uid value. That is fine when those fields are not needed. It becomes confusing only when those fields are configured and never appear, so keep the permissions and metadata list aligned.
The pipeline shape is the same for any OTLP backend: receive telemetry, protect the Collector, enrich with k8s_attributes, batch, then export. For Parseable, the exporter is still OTLP HTTP; the exporter block carries the Parseable endpoint, auth header and stream headers. The Kubernetes logs ingestion guide shows that end-to-end Parseable setup.
service:
  pipelines:
    logs:
      receivers: [otlp]
      processors: [memory_limiter, k8s_attributes, batch]
      exporters: [otlphttp/backend]
Once enriched data reaches the backend, queries can use k8s dimensions:
select count(*)
from kubernetes_logs
where k8s_namespace_name = 'payments'
group by k8s_deployment_name
The exact field name depends on how the backend maps OTLP resource attributes. Once those fields are present, queries can move from "show me all errors" to "show me errors for this namespace, Deployment, node or owning team."
Settings that change production behavior
The defaults are fine for a small cluster. In a busy cluster, these settings decide how much state the Collector watches, what happens during startup, and how much pressure it puts on the API server. They also affect semantic convention changes, because dashboards and alerts may depend on the exact attribute names being emitted.
-
Filter the watch set. For DaemonSet agents, set the node filter from the downward API so each Collector watches pods on its own node:
filter:
  node_from_env_var: KUBE_NODE_NAME
For a namespace-specific gateway, use a namespace filter when that gateway is responsible for one workload namespace:
filter:
  namespace: payments
Pods can also be filtered by k8s fields and labels:
filter:
  labels:
    - key: telemetry
      value: enabled
      op: equals
  fields:
    - key: status.phase
      value: Running
      op: equals
Filtering reduces memory use and API watch load. It also reduces the chance that a weak association rule matches something outside the intended watch set, which is especially useful in large clusters where the same naming patterns repeat across namespaces.
-
Decide whether startup should wait for metadata. By default, the processor can start before all metadata has been fetched, which means telemetry that arrives too early may pass through without enrichment. If the Collector should wait until metadata is synced, set:
wait_for_metadata: true
wait_for_metadata_timeout: 10s
That improves startup correctness, but it also means Collector startup can fail if metadata cannot sync in time. This setting is useful when missing metadata during startup is worse than a delayed Collector start, such as in a tightly controlled gateway path.
-
Tune informer resync in large clusters. k8s informers receive live watch events and can also periodically resync cached objects. The processor exposes:
watch_sync_period: 5mFor very large clusters, periodic resync can cause CPU and memory churn. Setting it to
0sdisables resync. That choice only makes sense when the trade-off is understood and the deployment is relying on watch events for state changes. -
Keep deleted pods briefly. Telemetry can arrive after a pod has been deleted, especially when exporters, queues or networks introduce delay. The processor keeps deleted pod metadata for a short grace period:
pod_delete_grace_period: 120sThis helps delayed logs, spans and metrics still get enriched. Increase it only if late telemetry is common. A long grace period keeps stale pod metadata in memory, so it should be treated as a recovery window rather than a general cache size knob.
-
Watch k8s API throttling. The shared k8s client settings are:
kube_api_qps: 5
kube_api_burst: 10
Those defaults match client-go defaults when unset. If Collector logs show client-side throttling, tune them carefully and watch API server health. Raising the numbers can reduce Collector delays, but it also lets the Collector put more pressure on the k8s API.
-
Avoid duplicate watchers when possible. If the same processor configuration is used in logs, metrics and traces pipelines, newer versions include a feature gate that can share one processor instance across pipelines. That reduces duplicate k8s API watchers. Treat feature gates as version-specific and read the component's
documentation.mdfor the Collector release being deployed, not just an old blog snippet.
Before upgrading, check the k8s attribute names.
The processor follows OpenTelemetry semantic conventions and has feature gates for the newer stable k8s attribute names. As of the recent v1.0.0 milestone, logs, metrics and traces signal support for
k8s_attributesis stable, and the semantic convention migration is no longer a future detail to ignore. The two gates to know areprocessor.k8sattributes.EmitV1K8sConventions, which emits the stable names, andprocessor.k8sattributes.DontEmitV0K8sConventions, which stops emitting the legacy names. Both are beta gates and enabled by default in the newer releases, so dashboards, alerts and saved queries should be checked before a Collector upgrade lands in production.
The migration mostly affects label and annotation naming:
k8s.pod.labels.<key>       -> k8s.pod.label.<key>
k8s.pod.annotations.<key>  -> k8s.pod.annotation.<key>
k8s.node.labels.<key>      -> k8s.node.label.<key>
k8s.node.annotations.<key> -> k8s.node.annotation.<key>
k8s.namespace.labels.<key> -> k8s.namespace.label.<key>
k8s.namespace.annotations.<key> -> k8s.namespace.annotation.<key>
container.image.tag        -> container.image.tags
If dashboards or queries depend on the old names, run a dual-emission window instead of flipping everything in one deploy:
--feature-gates=-processor.k8sattributes.DontEmitV0K8sConventions,processor.k8sattributes.EmitV1K8sConventionsThat keeps the stable names on while allowing the legacy names to continue during the migration. Once queries and alerts have moved to k8s.pod.label.*, k8s.pod.annotation.* and the other stable forms, the temporary gate override can be removed.
Common mistakes
Most mistakes with this processor are not syntax mistakes. The Collector often starts successfully, but the enrichment is missing, partial or attached to the wrong pod. When that happens, look at component activation, image distribution, pod association, processor order, RBAC and label scope before assuming the processor itself is broken.
- The processor is defined but not active. A
processors.k8s_attributesblock does nothing unless it is listed inservice.pipelines.<signal>.processors. This is the first place to check when the Collector starts cleanly but none of the expected k8s fields show up. - The Collector image does not include the processor. If the Collector fails with an unknown processor type, check the distribution. Use a distribution that includes
k8s_attributes, such as the Contrib or k8s distribution, or build a custom Collector that includes it. - The gateway matches the agent instead of the workload. If telemetry goes workload -> agent -> gateway, do not rely on the gateway's incoming connection IP. Send a resource attribute such as
k8s.pod.ipork8s.pod.uidfrom the agent and match on that at the gateway. - The processor runs after batch. When using
connectionassociation, putk8s_attributesbeforebatchand before tail sampling. Those processors can remove the connection context the k8s processor needs. - RBAC is too small for the extraction config. If pod fields appear but namespace, node or workload labels do not, compare the
extractconfig with RBAC. The processor can only enrich from resources it is allowed to read. - Too many labels become attributes. Copying every label and annotation feels convenient until queries slow down and the schema fills with low-value fields. Extract the labels we actually query.
Treat it like a join
The processor is a join between telemetry and k8s state. One stream is telemetry moving through the Collector, and the other stream is k8s resource metadata coming from informers. Pod association is the join key. If the key is wrong, missing or lost after batching, the rest of the config cannot fix the enrichment.
That makes the common decisions less fuzzy:
- Put the processor where the join key still exists.
- Prefer stable identifiers such as pod UID when available.
- Use pod IP only when the network path preserves the original pod identity.
- Filter the k8s watch set near the workload boundary.
- Extract labels like an index design, not like a data dump.
- Keep RBAC aligned with the exact metadata being requested.
Treating it as a join keeps the YAML honest. The processor should sit where the pod identifier still exists, extract only the metadata that will be used, and watch no more k8s state than the deployment needs. That is how enrichment stays reliable for logs, metrics and traces instead of becoming another noisy layer in the pipeline. If the collection runtime is still undecided, compare the OpenTelemetry Collector and Fluent Bit before choosing the enrichment layer.