If you ask an MCP-connected agent why there were many checkout errors last night, it will take several actions: list the datasets, read the schema, run a query, view the results, and then run a second query. These actions happen through tools and return telemetry data such as rows from a SQL query, series from a PromQL query, and pages of logs.
Models have no memory of previous interactions. Every time the agent asks the model what to do next, it must provide the full conversation, including the question, tool calls, and results. This can be a lot of data. A single query can return thousands of rows, and a PromQL range query returns every sample for each series. After a few interactions, results can fill most of the context window, a common agent context-saturation failure mode, and the bill starts to add up.
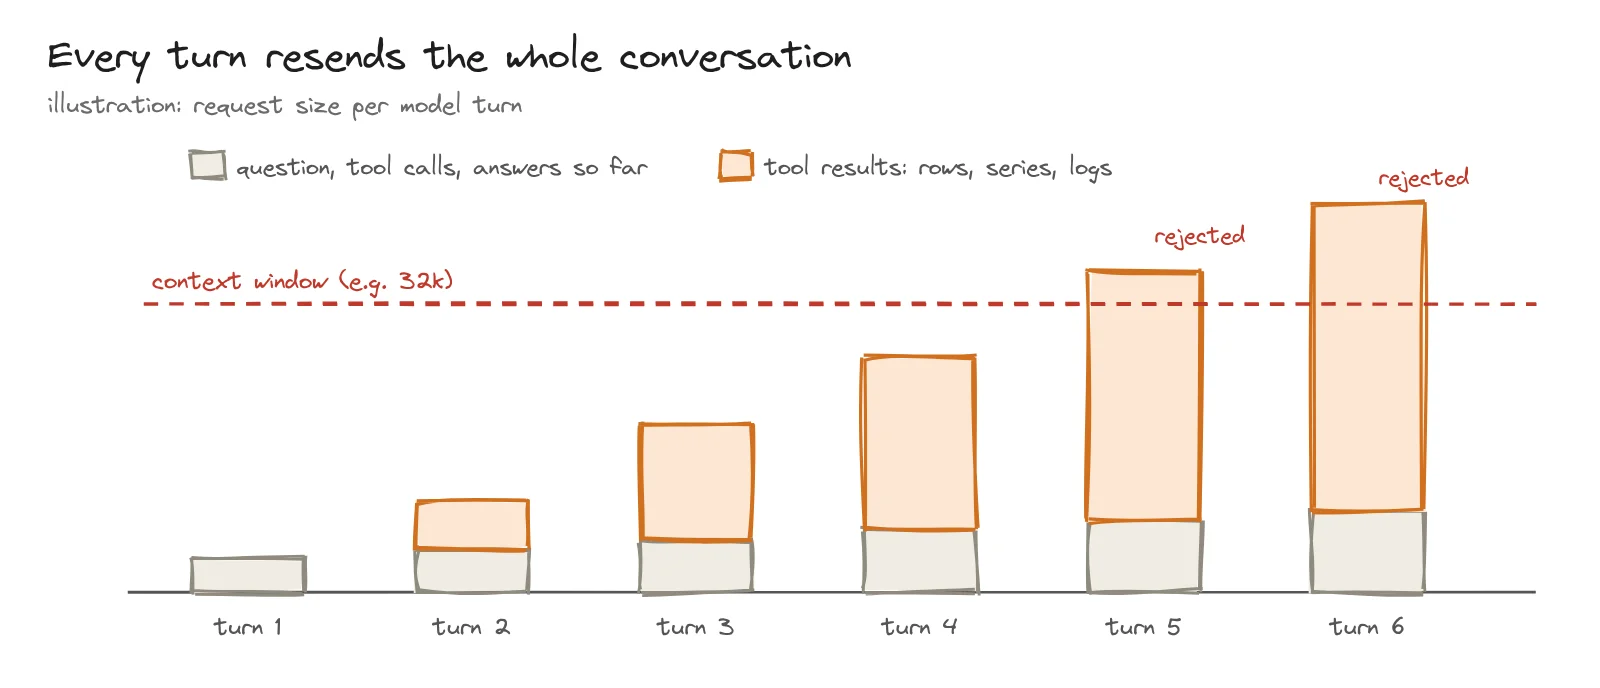
As self-hosted models become mainstream, this problem matters even more. If a request is too long, it is rejected, and you may still pay for a call that does nothing.
In this post, we walk through how we condense each type of Parseable tool output. We cover what gets condensed first when context is limited, how we set a model budget without a tokenizer, how the model reads back exact values, and what this saved across a real set of investigations.
Why the usual fixes fall short
There are a few common ways to fit within an agent's context window. They all fail with telemetry.
Truncate the oldest messages. This usually removes the initial tool calls used to identify the dataset, understand the schema, and narrow the time frame. The agent loses the reason it is looking at the current data.
Truncate to N rows. The question is often about an outlier, and the service with a 40% error rate may be on row 312. An arbitrary row limit can remove the answer.
Ask the model to summarize. This requires another model call and adds latency. The summary can also contain numbers that were not in the data.
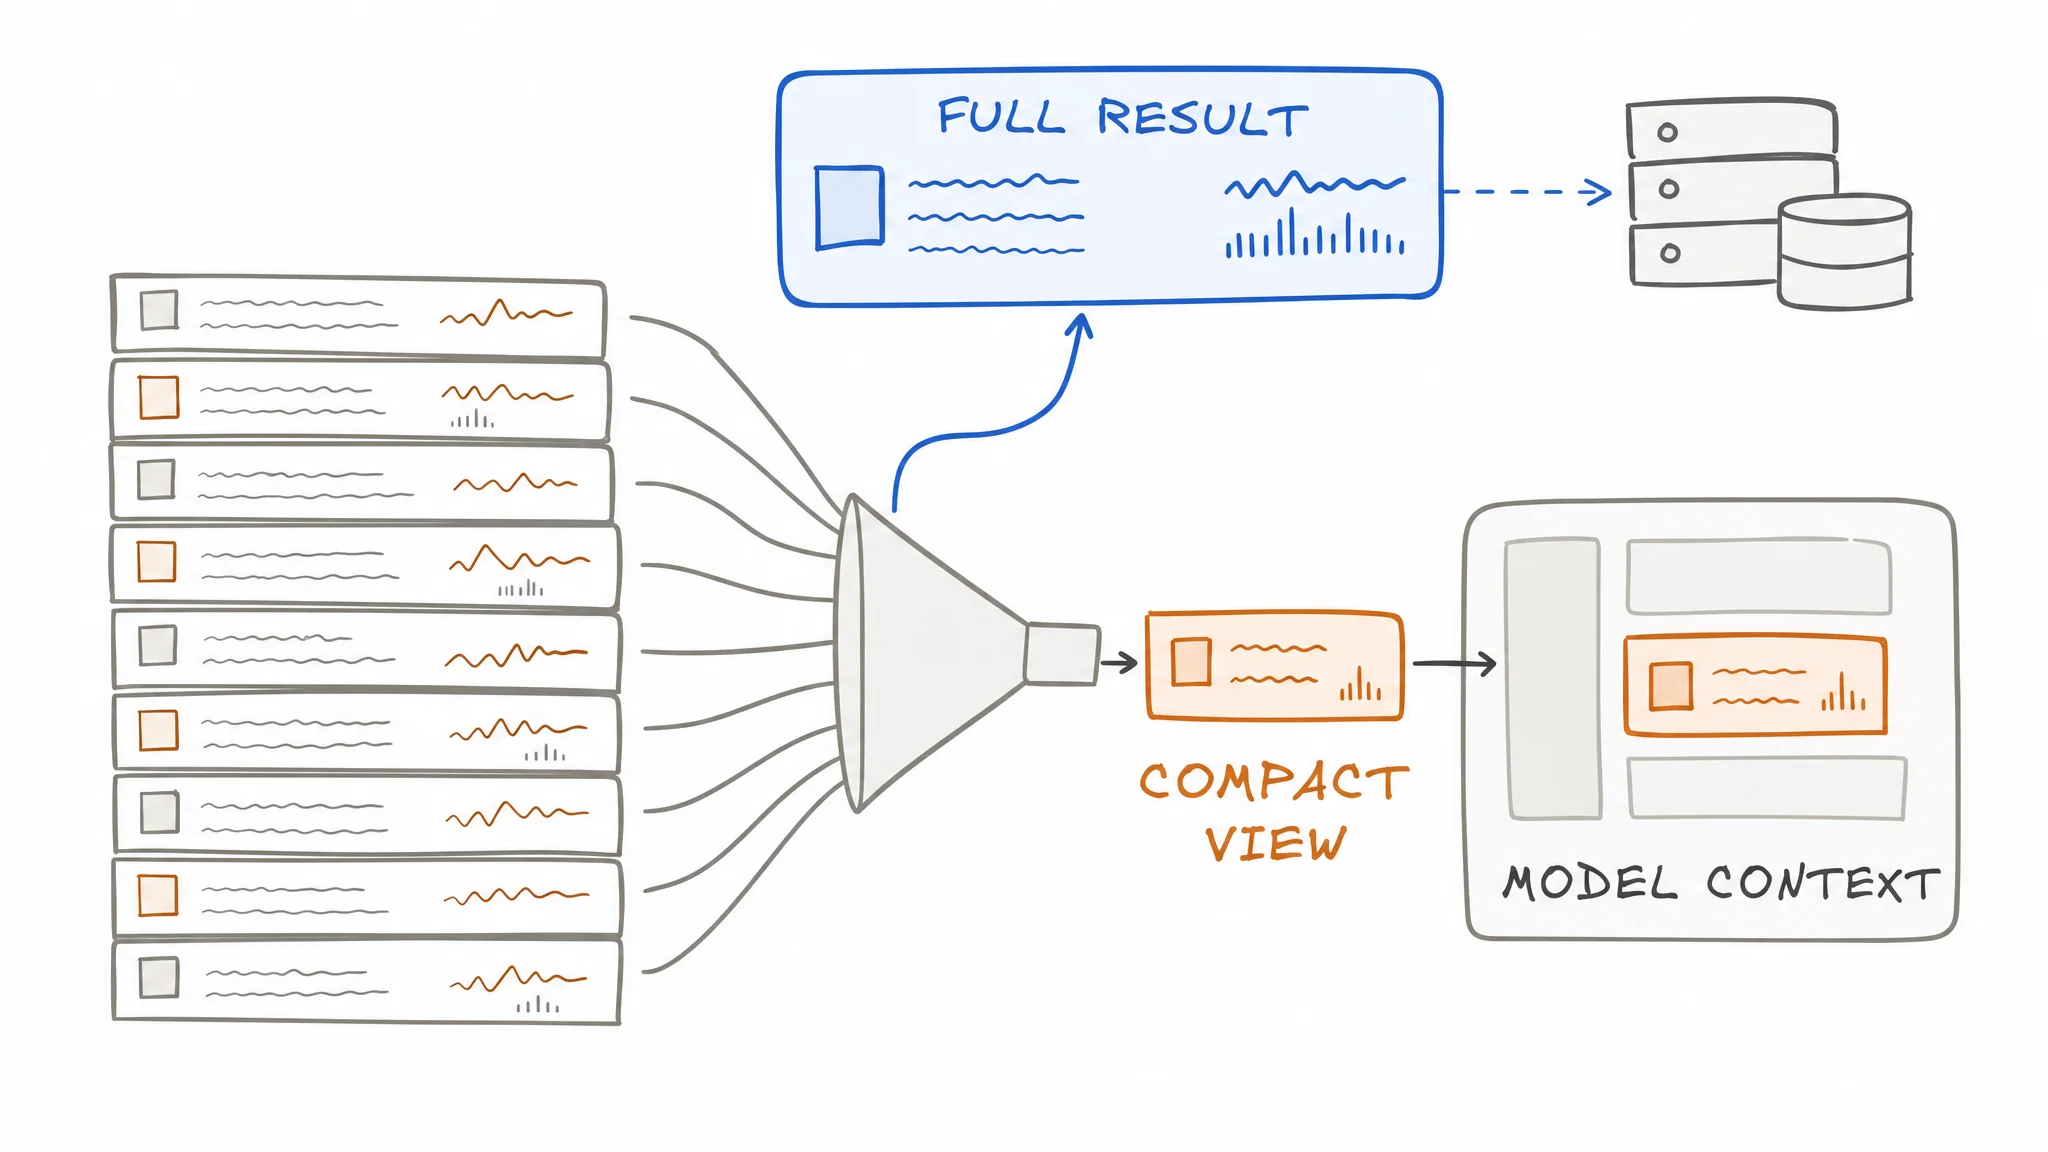
Parseable uses deterministic compaction instead. No model is involved. The compact form depends on the structure of each tool's output, and the original data remains available.
Our approach: keep everything and send a summary
Every Keystone agent, including Q&A, SQL and PromQL assistants, summaries, tiles, and dashboards, runs on the same agent runner. This loop sends the conversation to the model, runs the tools the model requests, and feeds the results back. Compaction lives in that loop, so it works the same way for every agent and across OpenAI, Anthropic, Ollama, and vLLM, which each format tool results differently.
All results are stored in full during an agent run. They are not shared between runs or conversations. At the end of a run, the stored results are discarded.
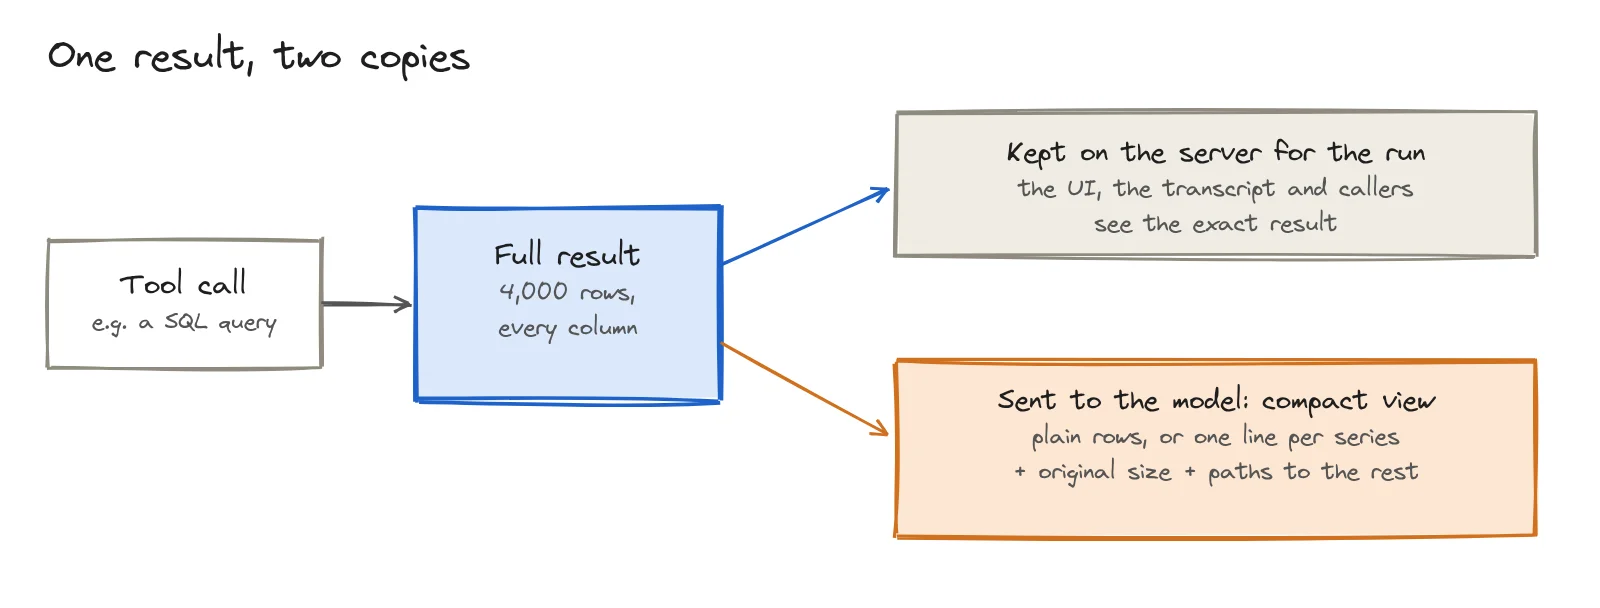
Only the model receives a compressed version. The Keystone UI, transcript, and caller receive the full version. If the agent runs a query that returns 4,000 rows, the UI shows all 4,000.
A result is compressed only when the compact version is smaller than the original. We never replace a small result with a larger summary.
How we shrink tables, series, and service data
Telemetry comes back in several formats, each with its own minimal representation.
Tables. SQL queries, dataset lists, metric lists, cardinality results, logs, traces, and errors return as tables. The compact format uses plain tab-separated text. It includes every column but removes the JSON keys, quotes, and brackets repeated for each row. Those repeated structures consume many bytes in wide tables.
PromQL series. A range query returns every sample from every series. The compact view reduces this to one row per series with its labels, sample count, and minimum, maximum, first, and last values. This is usually enough to identify which series changed and by how much.
Change points. The compact view summarizes metric and log change points. Because the change points are the reason for using the tool, it also includes them in full.
Service insights. The compact view includes an overview of the service and its resources but omits time-series data.
Every summary includes the original size in bytes and the paths the model can use to access missing data. The model always knows it is working from a summary and how to retrieve the rest.
The dataset schema offers the largest early saving. Before an agent writes a query, it reads the schema. Our astronomy-shop traces dataset has 253 columns.
As Arrow schema JSON, it is 29,336 bytes:
{"fields":[{"name":"app.ads.ad_request_type","data_type":"Utf8","nullable":true,
  "dict_id":0,"dict_is_ordered":false,"metadata":{}},
 {"name":"app.ads.ad_response_type","data_type":"Utf8","nullable":true,
  "dict_id":0,"dict_is_ordered":false,"metadata":{}},
 … 253 fields]}
The model gets 6,221 bytes:
name                      type
app.ads.ad_request_type   Utf8
app.ads.ad_response_type  Utf8
app.cache_hit             Boolean
app.order.amount          Float64
p_timestamp               Timestamp(ms)
…
That is 79% smaller, while the model retains every column name and type it needs to write a query. Most of the JSON consisted of the same four fields repeated 253 times: nullable, dict_id, dict_is_ordered, and metadata. This optimization happens before the runner: the schema tool returns the short form directly, so MCP clients receive it too.
How compaction works and in which order
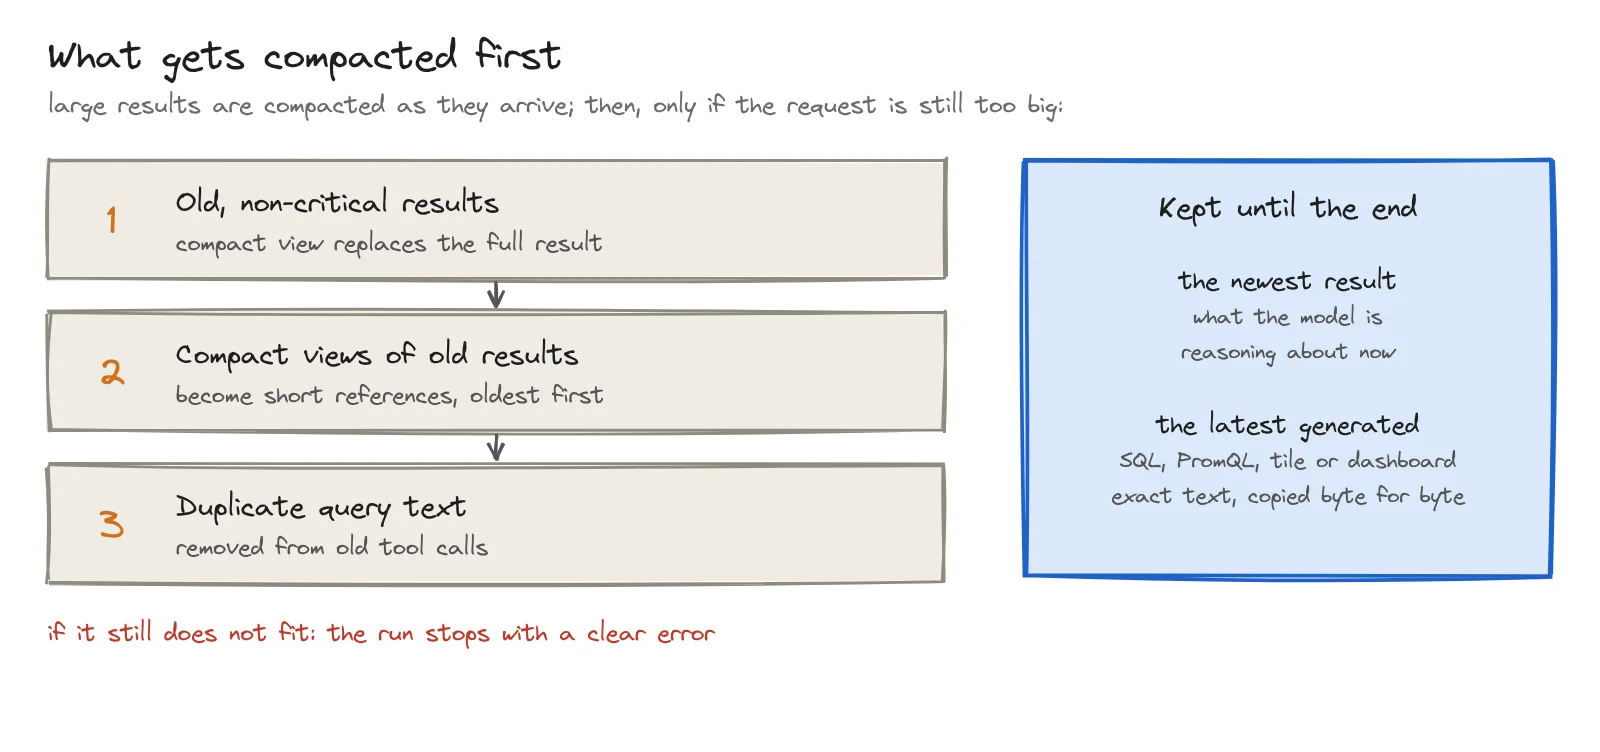
Large results are compacted as soon as they arrive. We do not wait for a provider to reject a request because every retry would resend the full results.
If a request is still too large, compaction continues in this order:
- Compact old results that are not critical to answering the question.
- If that is not enough, replace compact summaries with brief references to the full results, starting with the oldest summaries.
- Remove duplicate long SQL or PromQL text from old tool calls. Queries often appear twice in the history: once in the tool call and once in the result.
The runner retains the latest result and the latest generated or verified SQL, PromQL, tile, or dashboard. The latest result represents what the model is currently reasoning about. A generated query must also be present in the final result.
This second rule needs care. If the model is asked to provide a query generated three turns ago, it must reproduce the query exactly. When we compact a generated query, we keep its exact text and tell the model to copy it verbatim.
Counting tokens without a tokenizer
To know whether a request is too large, you need an estimate of its token count. The standard approach is to run the provider's tokenizer. That means shipping four tokenizers, one per provider, keeping them current, and handling self-hosted models that do not provide an easy-to-run tokenizer.
We do not run a tokenizer. The runner learns from the provider instead:
- Rate. After each successful call, the provider reports the input tokens used. The runner knows how many bytes it sent, so it learns the model's bytes-per-token rate for that run.
- Limit. If a request overflows, the runner reads the limit from the error. It subtracts the requested output tokens from the maximum context to calculate the input budget.
- Buffer. Requests target 90% of the limit. Bytes are a proxy for tokens, and the ratio changes with message format, so the runner keeps a buffer.
- Overflow. After recovering from an overflow, subsequent requests are limited to 90% of the last successful request. Otherwise, the next tool response could immediately reach the limit again.
If a request still does not fit after all available compaction, the run stops with a clear error. It does not keep retrying.
We are charged one token per retry. This is why vLLM needs the last rule. If a request exceeds the maximum length, vLLM stops counting tokens and returns an error saying the prompt contains at least the limit plus one token. Treating this lower bound as the true length would make the runner shorten the next request by one token, overflow again, and repeat. One turn could produce hundreds of charges. Instead, the runner compacts as much as possible in one pass and attempts the request once more.
How the model retrieves what the summary left out
A small summary is usually enough. Sometimes, however, the model needs to know exactly when a sequence peaked or retrieve a specific row from a table.
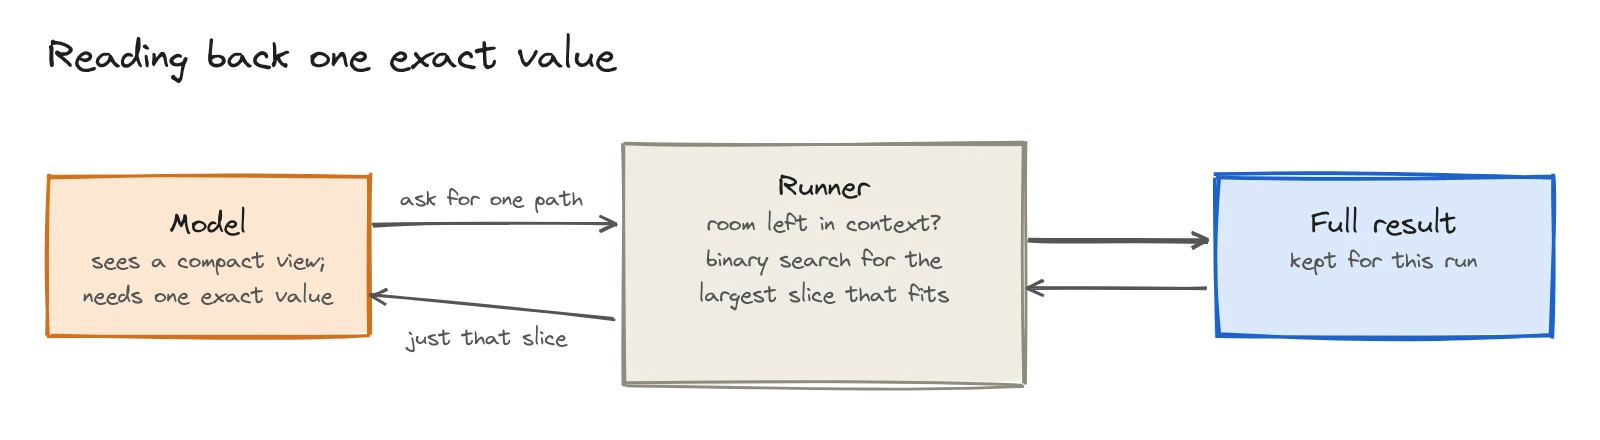
After any result is compacted, the runner exposes an extra tool for reading a section of the stored result. This internal tool reads from the current run's memory and is never available to external MCP clients.
read_tool_result retrieves a specific part of a tool call. It takes the tool call ID and a JSON Pointer such as /rows or /data/result/3. The model does not have to guess the available paths. Every condensed view lists the top-level paths in the full result and tells the model to request a precise path. The tool should not paginate through an entire result.
{
  "tool": "read_tool_result",
  "toolCallId": "<id of the earlier call>",
  "jsonPointer": "/rows"
}
Three rules keep retrieval from breaking compaction:
- The answer is sized to fit. The runner calculates the remaining context space and uses a binary search to find the largest slice of the requested section that fits.
- The model cannot paginate through results. If it reads one page at a time, pages one through four may be compacted before it reaches page five. The model must request a specific path.
- Only the latest read is retained. Older reads are already reflected in the model's next action, so the runner replaces them with a short “already delivered” message.
One final guard prevents loops. If a tool call exactly matches an earlier successful call, the runner refuses it and returns a no progress message. The model must use the earlier response or try something different.
Testing it on a small self-hosted model
We tested Keystone with Qwen3.5 14B on vLLM and a 32k-token window, the kind of self-hosted setup where context runs out first. We ran a consistent set of investigations against OpenTelemetry demo data.
| Item | Value |
|---|---|
| Investigations | 12 fixed questions, including checkout errors, p95 latency, Kafka lag, and slow checkout traces |
| Data | astronomy-shop OpenTelemetry demo logs, traces, and metrics |
| Model | Qwen3.5 14B on vLLM, 32k-token window |
| Agent | Keystone Q&A with access to every read-only tool |
| Measured | Input and cached tokens, model calls, tool calls, every full tool result, and the final answer |
Each investigation ran once with compaction enabled. This produced a stream of events with every tool result recorded in full. Applying the same compaction logic to this data shows what the model would have received. Figures marked as estimates apply the fully recorded results to each request and convert bytes to tokens at approximately four bytes per token.
What we found
Eleven of the twelve investigations finished. The twelfth stopped when the model returned a reply with neither an answer nor a tool call.
| Measure | Without compaction | With compaction | Note |
|---|---|---|---|
| Investigations finished | Not run | 11 of 12 | One ended with an unusable final reply |
| Cumulative input tokens per investigation | ~313,600 estimated | 313,620 | Most results were small, so the median barely changed; 95% came from vLLM's prefix cache |
| Largest single request | ~40,000 tokens estimated | ~26,000 tokens estimated | Service-insights investigation |
| Investigations over the 32k window | 1 of 11 estimated | 0 of 11 | Same service-insights investigation |
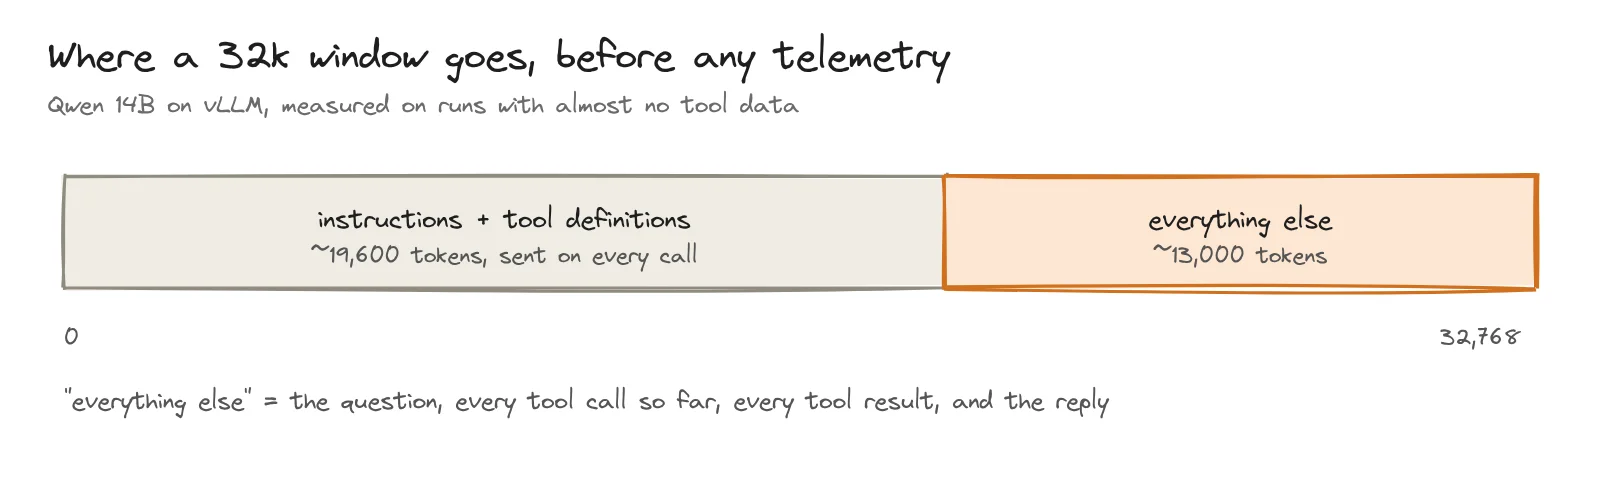
| Fixed cost per model call | ~19,600 tokens | ~19,600 tokens | Instructions and tool definitions used about 60% of the window; compaction does not change them |
Four findings stood out.
The window was mostly full before any telemetry arrived. In the two cases that returned little data, each model call required about 19,600 input tokens. This included all Keystone instructions and every read-only Q&A tool definition, consuming about 60% of the 32k window. The question, tool calls, results, and reply had to fit in the remaining 13,000 tokens.
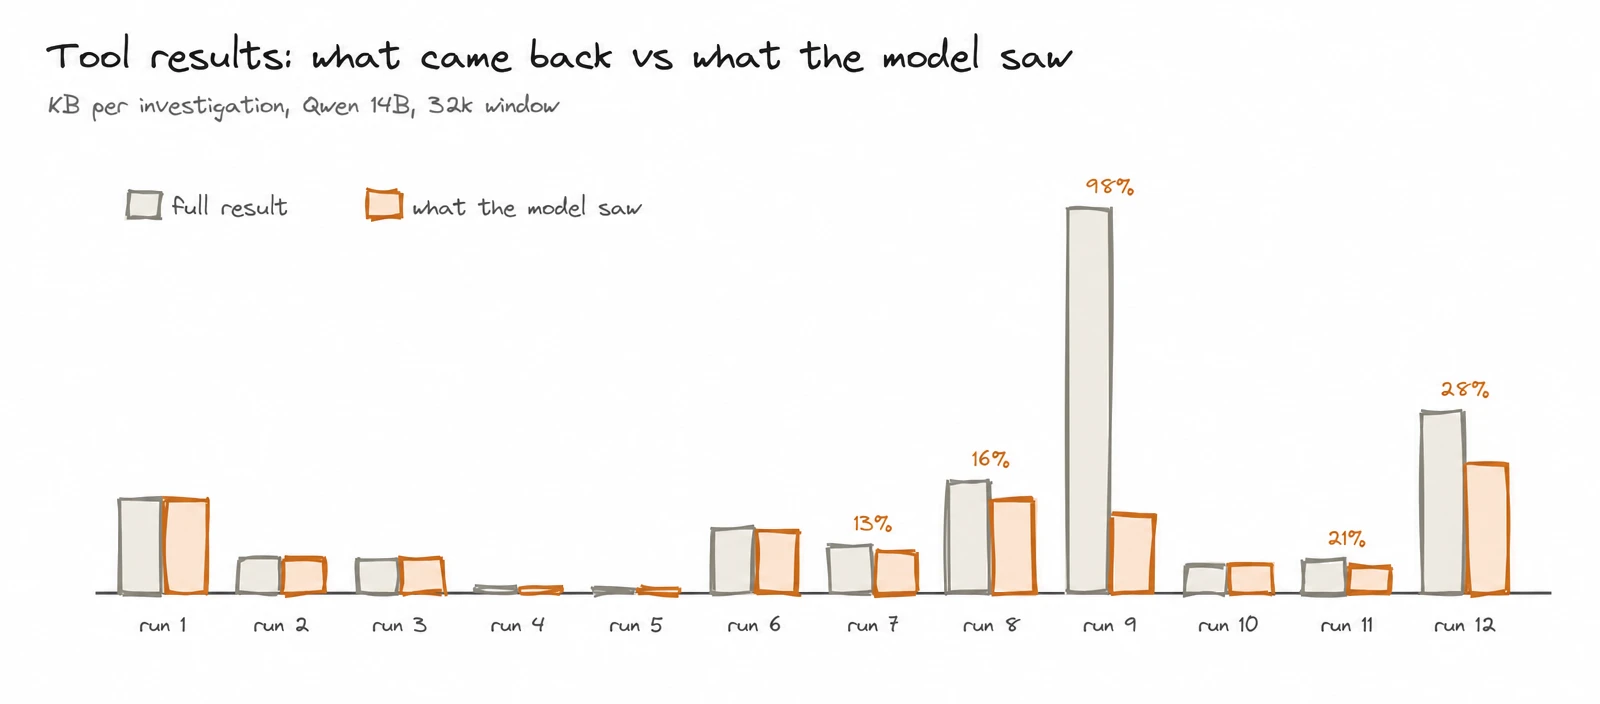
Compaction had the greatest effect on large results. Across all 12 investigations, 199 KB of tool results fell to 123 KB in model context, a 38% reduction. One service-insights investigation fell from 60.7 KB to about 1 KB, a reduction of about 98%. Investigations that only listed datasets and ran small queries barely changed because their results were already small enough to pass through.
The budget rules were exercised. During one investigation, the model called read_tool_result to read rows from an earlier trace-activity result. The runner replied that no context space remained for the compressed result. The model continued with the compact view and completed the investigation.
About half of the model calls were retries. Most happened when the runner asked the model to try again after returning no usable response, such as a reply without a tool call. The 14B model was less reliable at tool calls than a large hosted model. Based on the token counts, most retries were not overflows and were not caused by compaction.
We also ran the 12 questions against a large-window hosted model, gpt-5.4-nano. Compaction reduced bytes by only about 5%. No request came close to the context limit, so compaction happened only when large outputs first arrived. It matters most with small context windows, which are also where teams are likely to run smaller models.
The trade-offs
Summaries lose information. If a summary lacks a required value, the model must make another read request. This adds a turn and depends on the model recognizing what is missing.
The runner estimates rather than counts tokens. The learned rate is a good proxy, but it depends on message structure. The 10% buffer covers most variation, not every case.
Memory lasts for one run. The complete result is stored during the agent run and discarded afterward. Nothing carries between conversations, so a follow-up question the next day starts from scratch.
Each summary is tool-specific. A new tool defaults to a reference to its complete result until we add a compact representation for that output.
The model gets the map; the server keeps the data
An agent does not need every row in its context. It needs to know what came back, how much data exists, and how to retrieve the exact section required. The compact view is a map of the data.
Parseable stores the full result on the server for the run and sends the map to the model. The model reasons over that map and requests details only when needed. The original result stays intact, without relying on a potentially incorrect model-generated summary.