
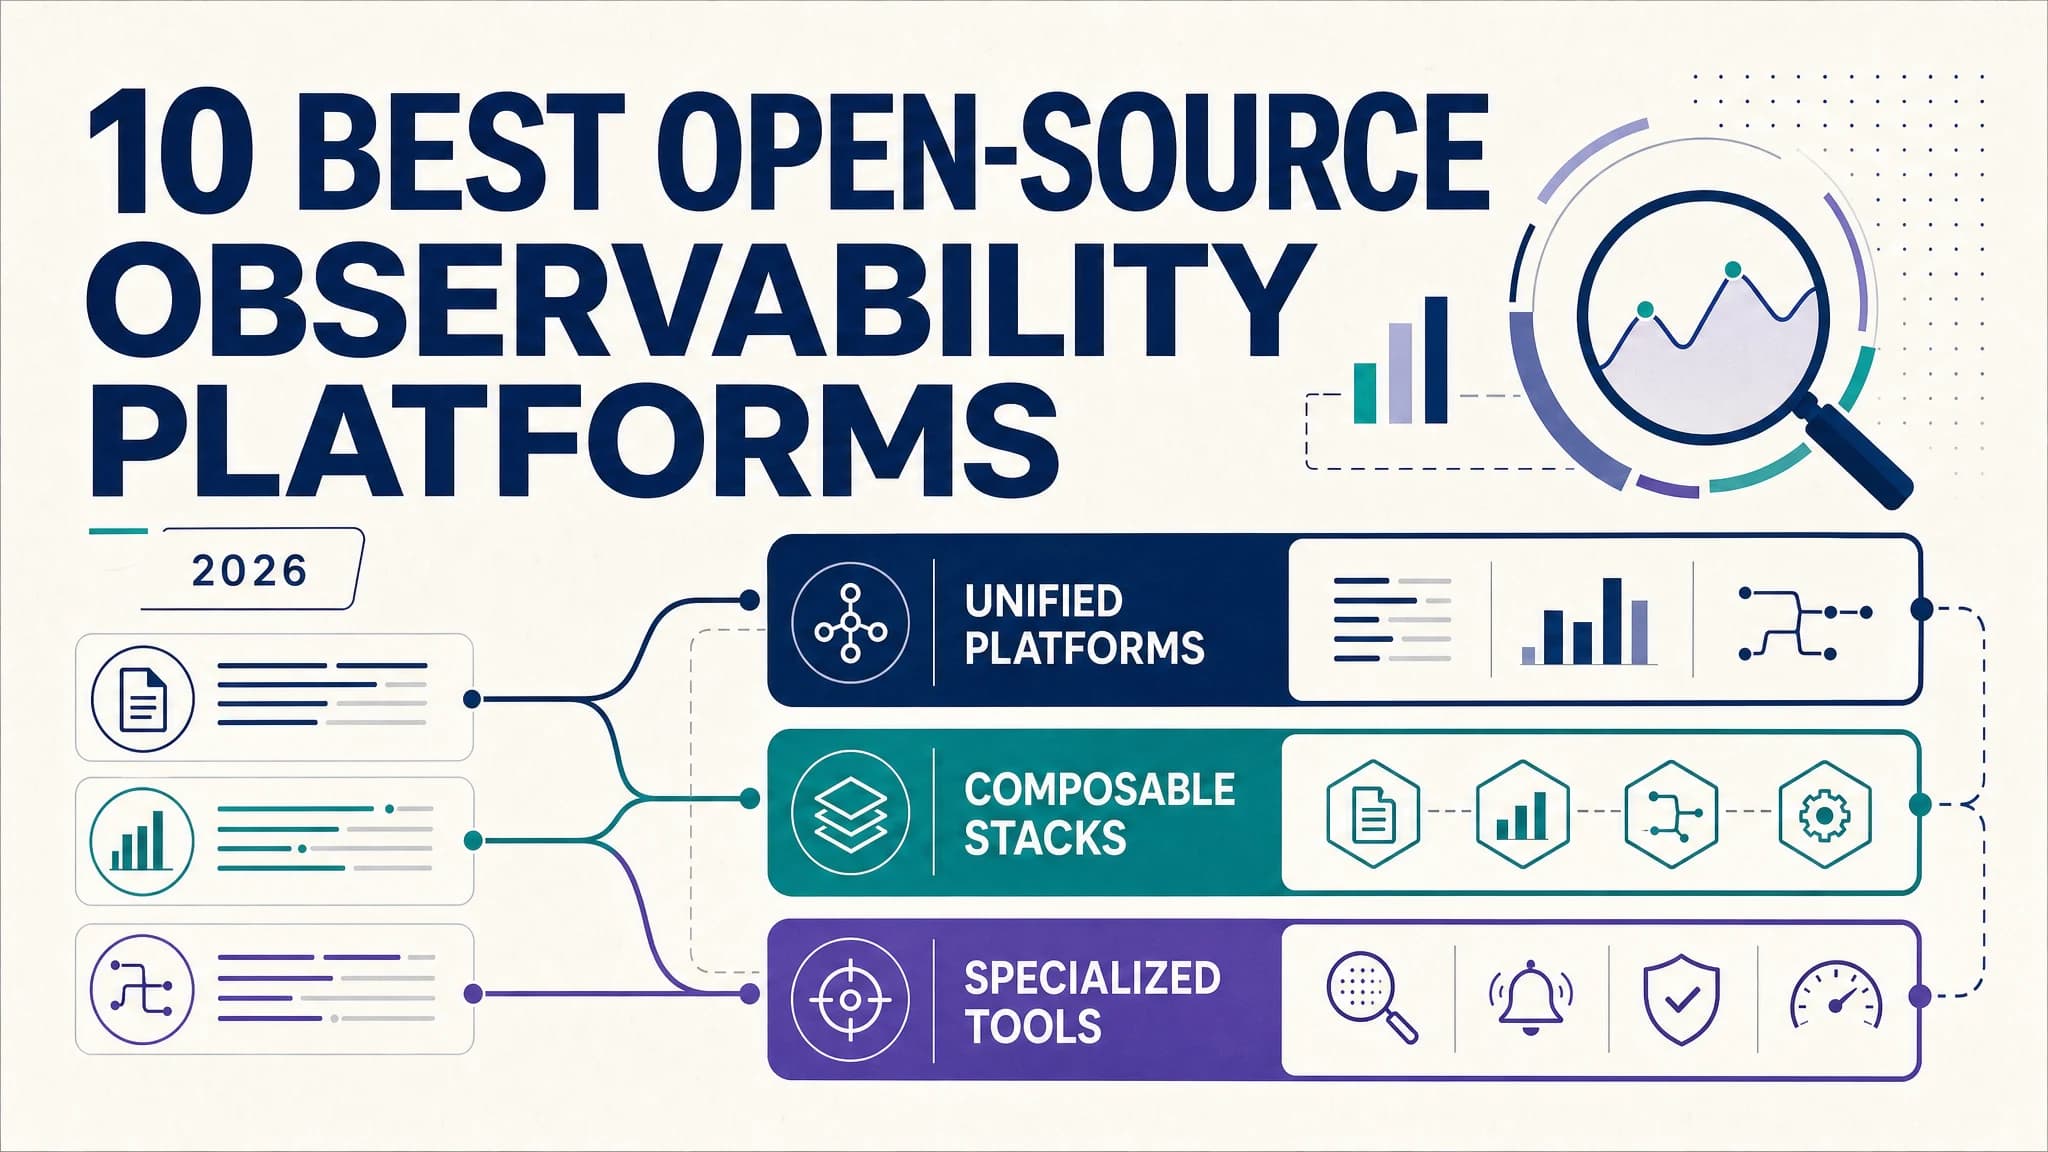
Choose an open-source observability platform based on the system your team is prepared to operate. Parseable, SigNoz and OpenObserve provide a unified product for logs, metrics and traces. Grafana LGTM gives teams more freedom to compose a stack. ClickStack and HyperDX suit ClickHouse-centered debugging, while SkyWalking and Uptrace are stronger when tracing drives the investigation.
The comparison covers telemetry, storage, query model, license and self-hosting effort. Engineering teams evaluate cohesive platforms alongside composed open-source observability tools when replacing a proprietary service.
Disclosure: Parseable publishes this guide and appears in the comparison. The order is not an aggregate ranking. We reviewed public documentation and repositories in August 2026, but we did not run every product through the same benchmark. Use the shortlist to choose two or three candidates, then test them with your own ingestion rate, retention period and queries.
Best open-source observability platforms at a glance
| Platform | Best for | Telemetry | Query model | License | Self-hosting shape |
|---|---|---|---|---|---|
| Parseable | Unified telemetry on object storage | Logs, metrics, traces, events | SQL, PromQL | AGPL-3.0 | Single product; distributed deployment available |
| Grafana LGTM | Teams that want a composable stack | Logs, metrics, traces | LogQL, PromQL, TraceQL | Varies by component | Several services and query languages |
| SigNoz | OpenTelemetry-first APM | Logs, metrics, traces, exceptions | Query builder, ClickHouse SQL | MIT core; separate enterprise code | Product plus ClickHouse |
| OpenObserve | Object-storage-based log analytics | Logs, metrics, traces, frontend monitoring | SQL, PromQL | AGPL-3.0 | Single product with object storage |
| ClickStack | ClickHouse-native observability at scale | Logs, metrics, traces, session replay | SQL, Lucene-style search | Varies by component | Supported bundle of OSS components |
| HyperDX | Fast debugging and session replay | Logs, metrics, traces, errors, sessions | SQL, Lucene-style search | MIT | UI and workflow layer on ClickHouse |
| OpenSearch Observability | Existing OpenSearch users | Logs, traces, metrics through integrations | PPL, DQL | Apache-2.0 | OpenSearch cluster and plugins |
| Apache SkyWalking | Service topology and distributed tracing | Traces, metrics, logs | MQE, native query APIs | Apache-2.0 | OAP backend, storage and UI |
| VictoriaMetrics stack | Metrics-heavy infrastructure | Metrics and logs; tracing external | MetricsQL | Apache-2.0 core | Separate metrics and logs products |
| Uptrace | Trace-led OpenTelemetry teams | Traces, metrics, logs | Query builder | AGPL-3.0 | Uptrace, ClickHouse and PostgreSQL |
“Open source” does not mean every commercial feature is included. Some vendors keep SSO, advanced RBAC, or support in paid editions. Component licenses can also differ inside a stack. Review the linked repositories before adopting a platform for redistribution or embedded use.
What open-source observability platforms actually do
An observability platform collects, stores and queries logs, metrics and traces, then preserves enough context to move between those signals during an investigation. OpenTelemetry standardizes how telemetry is generated and transported, but the platform still supplies storage, search, dashboards and alerting.
Open-source observability platforms vs monitoring tools
Monitoring tells you when a known condition crosses a threshold. An observability platform helps you investigate failures you did not predict by correlating telemetry from across the system.
Open-source observability platform vs open-source observability stack
A platform ships the main ingestion, storage, query and visualization workflows as one product. A stack combines independently operated components. Platforms reduce integration work, while stacks give teams more freedom to replace or scale each component separately.
What to look for in open-source observability platforms
We used five criteria that affect a production deployment after the demo works:
- Investigation workflow: Can engineers move between logs, metrics and traces without rebuilding context?
- OpenTelemetry support: Can the platform accept standard telemetry without proprietary application instrumentation?
- Storage and query model: What must the team operate and which query languages must it learn?
- Day-two work: How many services need scaling, upgrading, backing up and securing?
- License and deployment control: Can the team self-host the useful core and keep telemetry in its chosen environment?
We did not score community size, benchmark results, or pricing because those figures change quickly and rarely predict performance on a specific workload. For a serious evaluation, replay representative telemetry and measure ingest stability, p95 query latency, recovery behavior, storage growth and operator time.
Top 10 open-source observability platforms in 2026
1. Parseable: Best open-source observability platform for cost-efficient unified telemetry
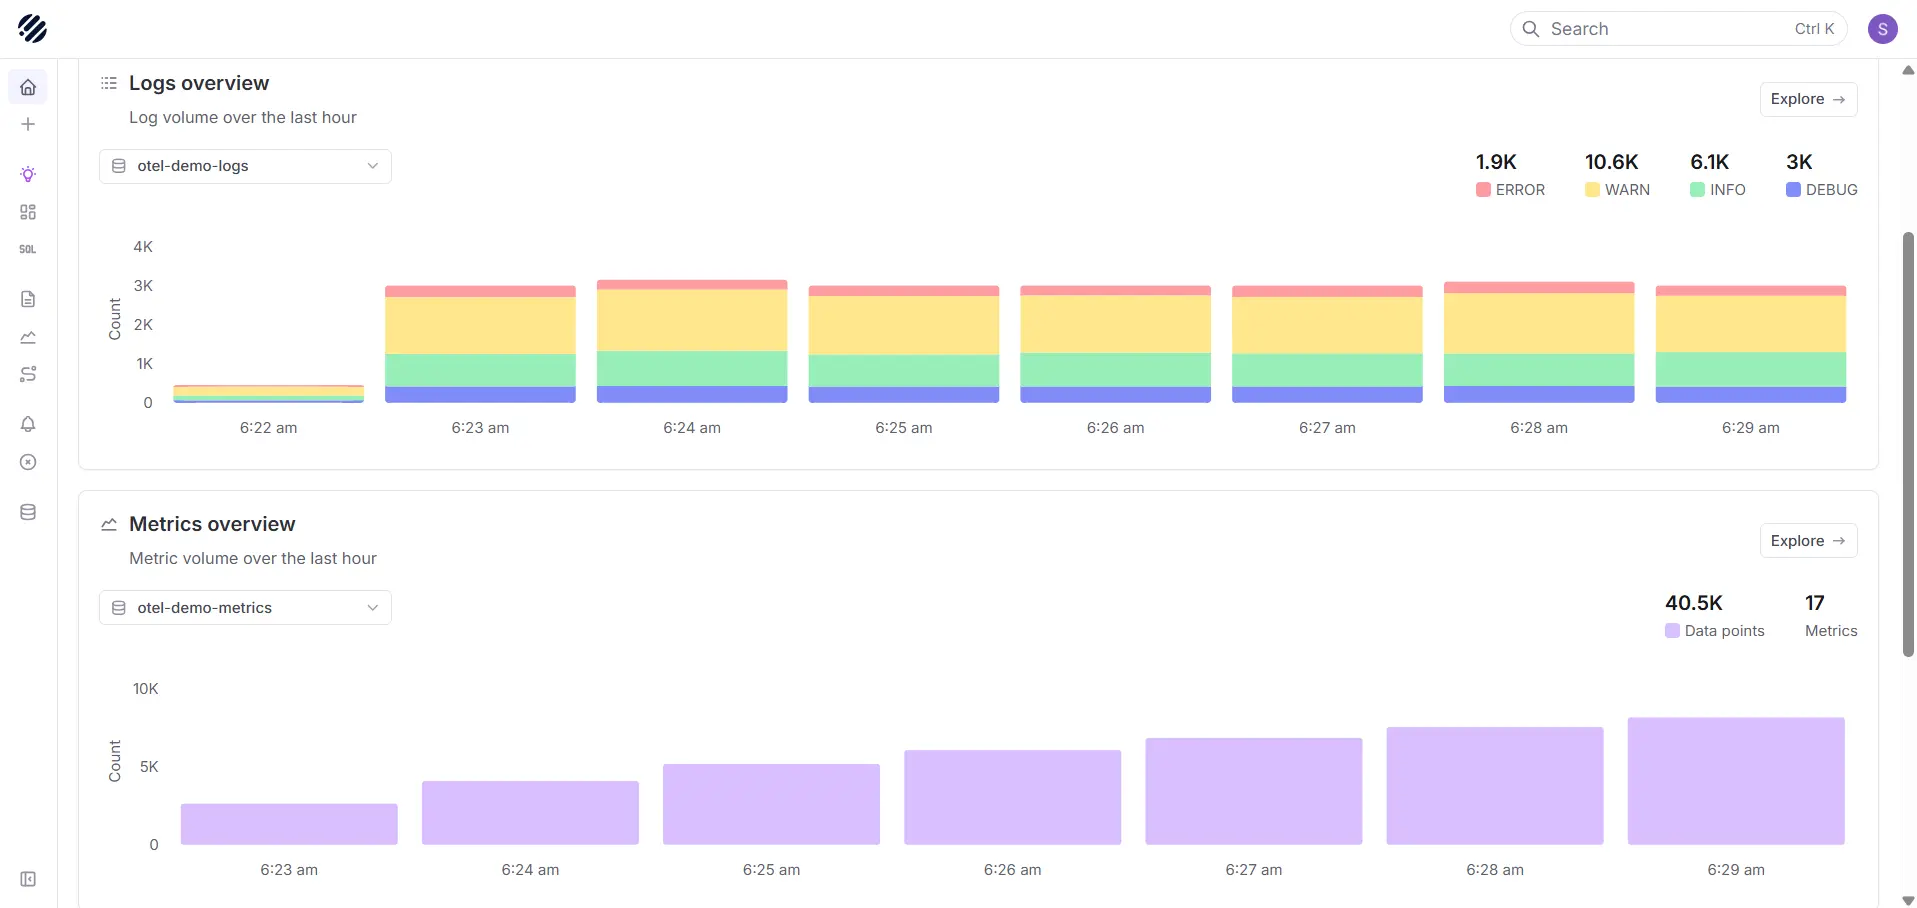
Best for: Teams that want one self-hosted observability product, SQL and PromQL access and independently scalable object storage.
Parseable is an OpenTelemetry-native platform built in Rust. It stores columnar telemetry in Apache Parquet using an observability data lake architecture and supports logs, metrics, traces and events from a single product. Its object-storage design separates durable storage from compute, which is useful when retention grows faster than query demand.
Engineers can use SQL for structured investigation and PromQL for metric workflows. Built-in dashboards, alerts, anomaly detection and APM avoid the need to assemble a separate UI and alerting layer. Parseable can run as a single binary for evaluation and as distributed ingest and query services for larger installations.
Watch for: Parseable has a smaller integration and dashboard ecosystem than Grafana. Test any source-specific integrations and governance requirements during the proof of concept.
Run Parseable yourself or start a cloud trial.
2. Grafana LGTM Stack: Best open-source observability stack for composable teams
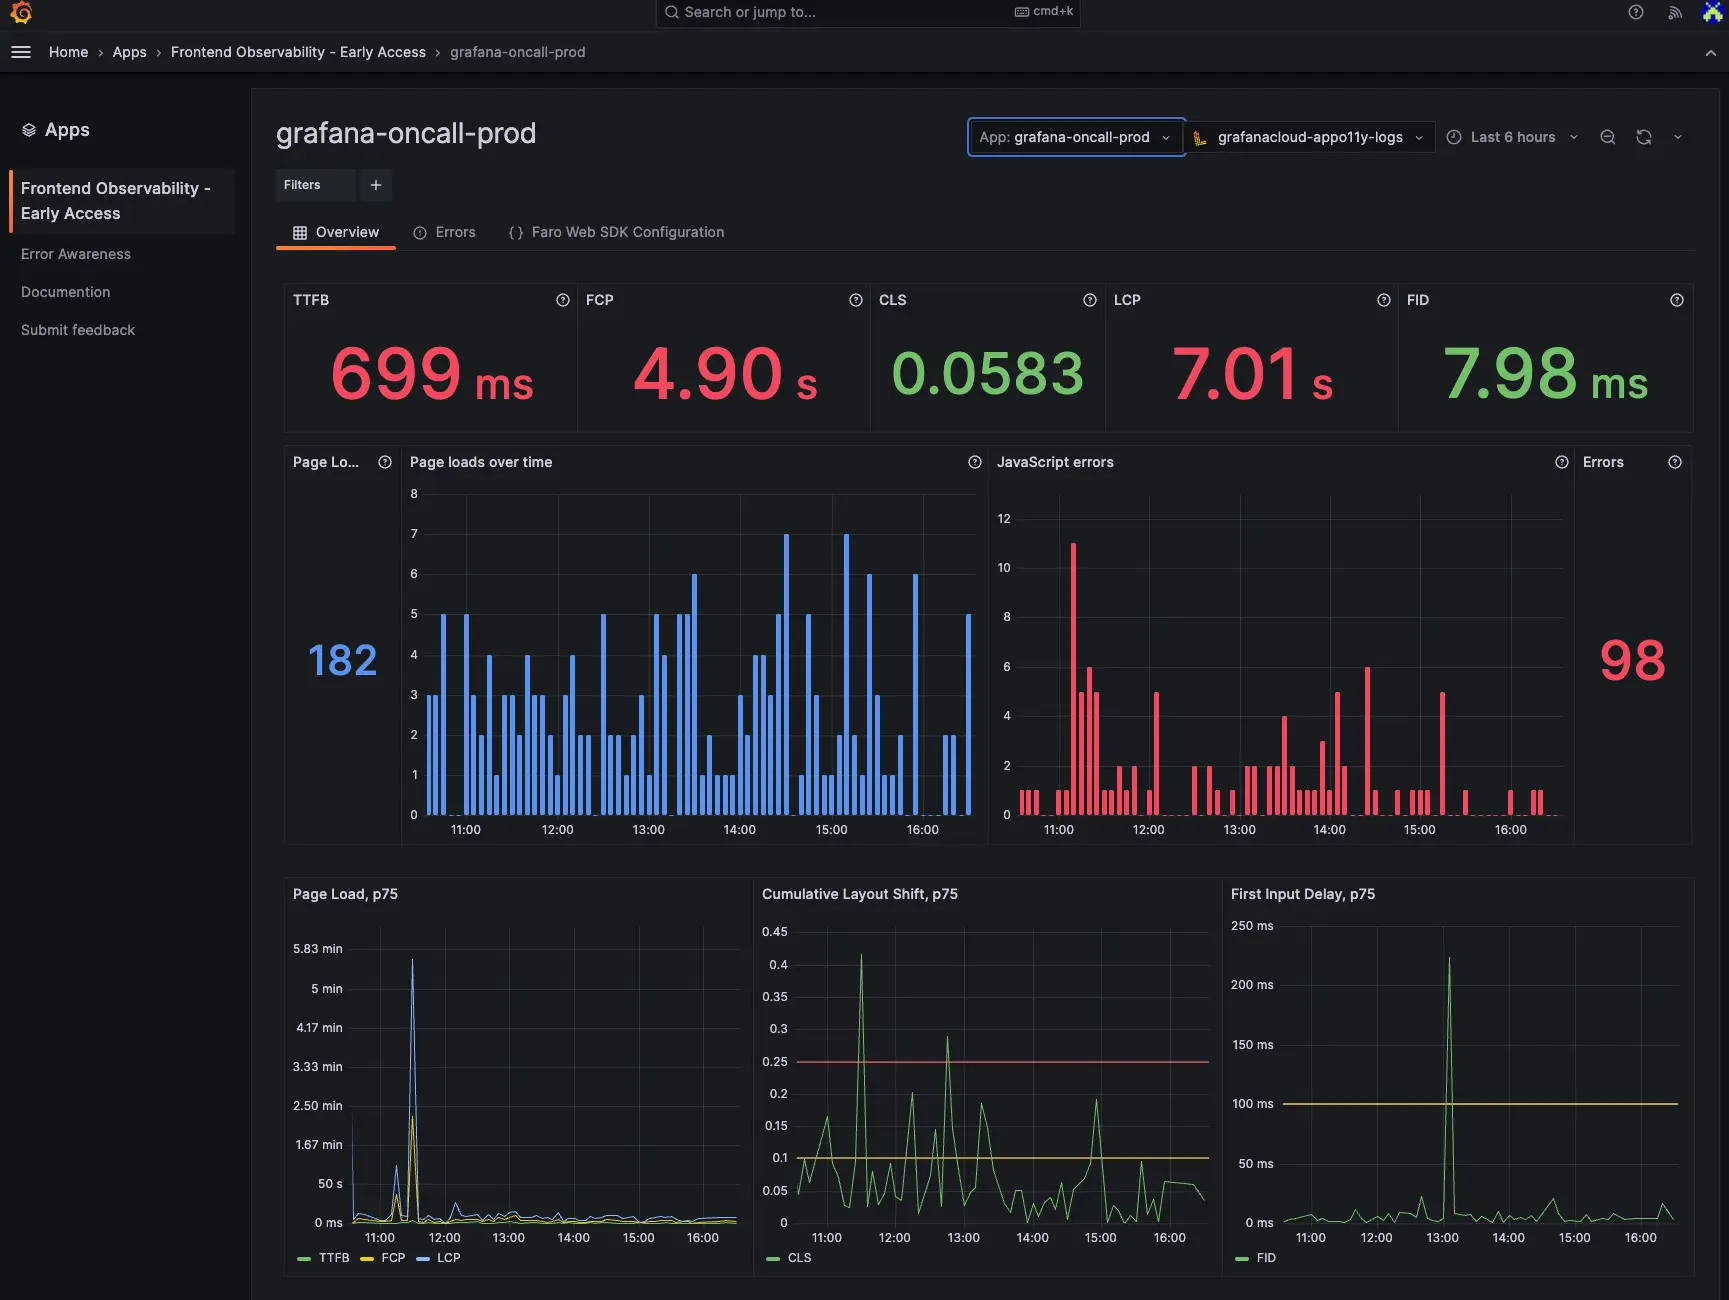
Best for: Teams already invested in Grafana and Prometheus that prefer replaceable components over one product.
The Grafana LGTM stack combines Loki for logs, Grafana for visualization, Tempo for traces and Mimir for Prometheus-compatible metrics. Each project can be adopted independently, so a team can keep an existing Prometheus deployment and add only Loki or Tempo.
Modularity lets teams adopt and replace components independently. Operators must still manage several services, storage paths and scaling models. Engineers also move among LogQL, PromQL and TraceQL. Grafana connects the signals through exemplars and derived fields once the team configures the links and maintains consistent resource attributes.
Watch for: Do not compare the installation effort of Grafana alone with a unified platform. Compare the complete set of components, their object stores, alerting, tenancy and upgrade procedures.
3. SigNoz: Best open-source observability platform for OpenTelemetry-first teams
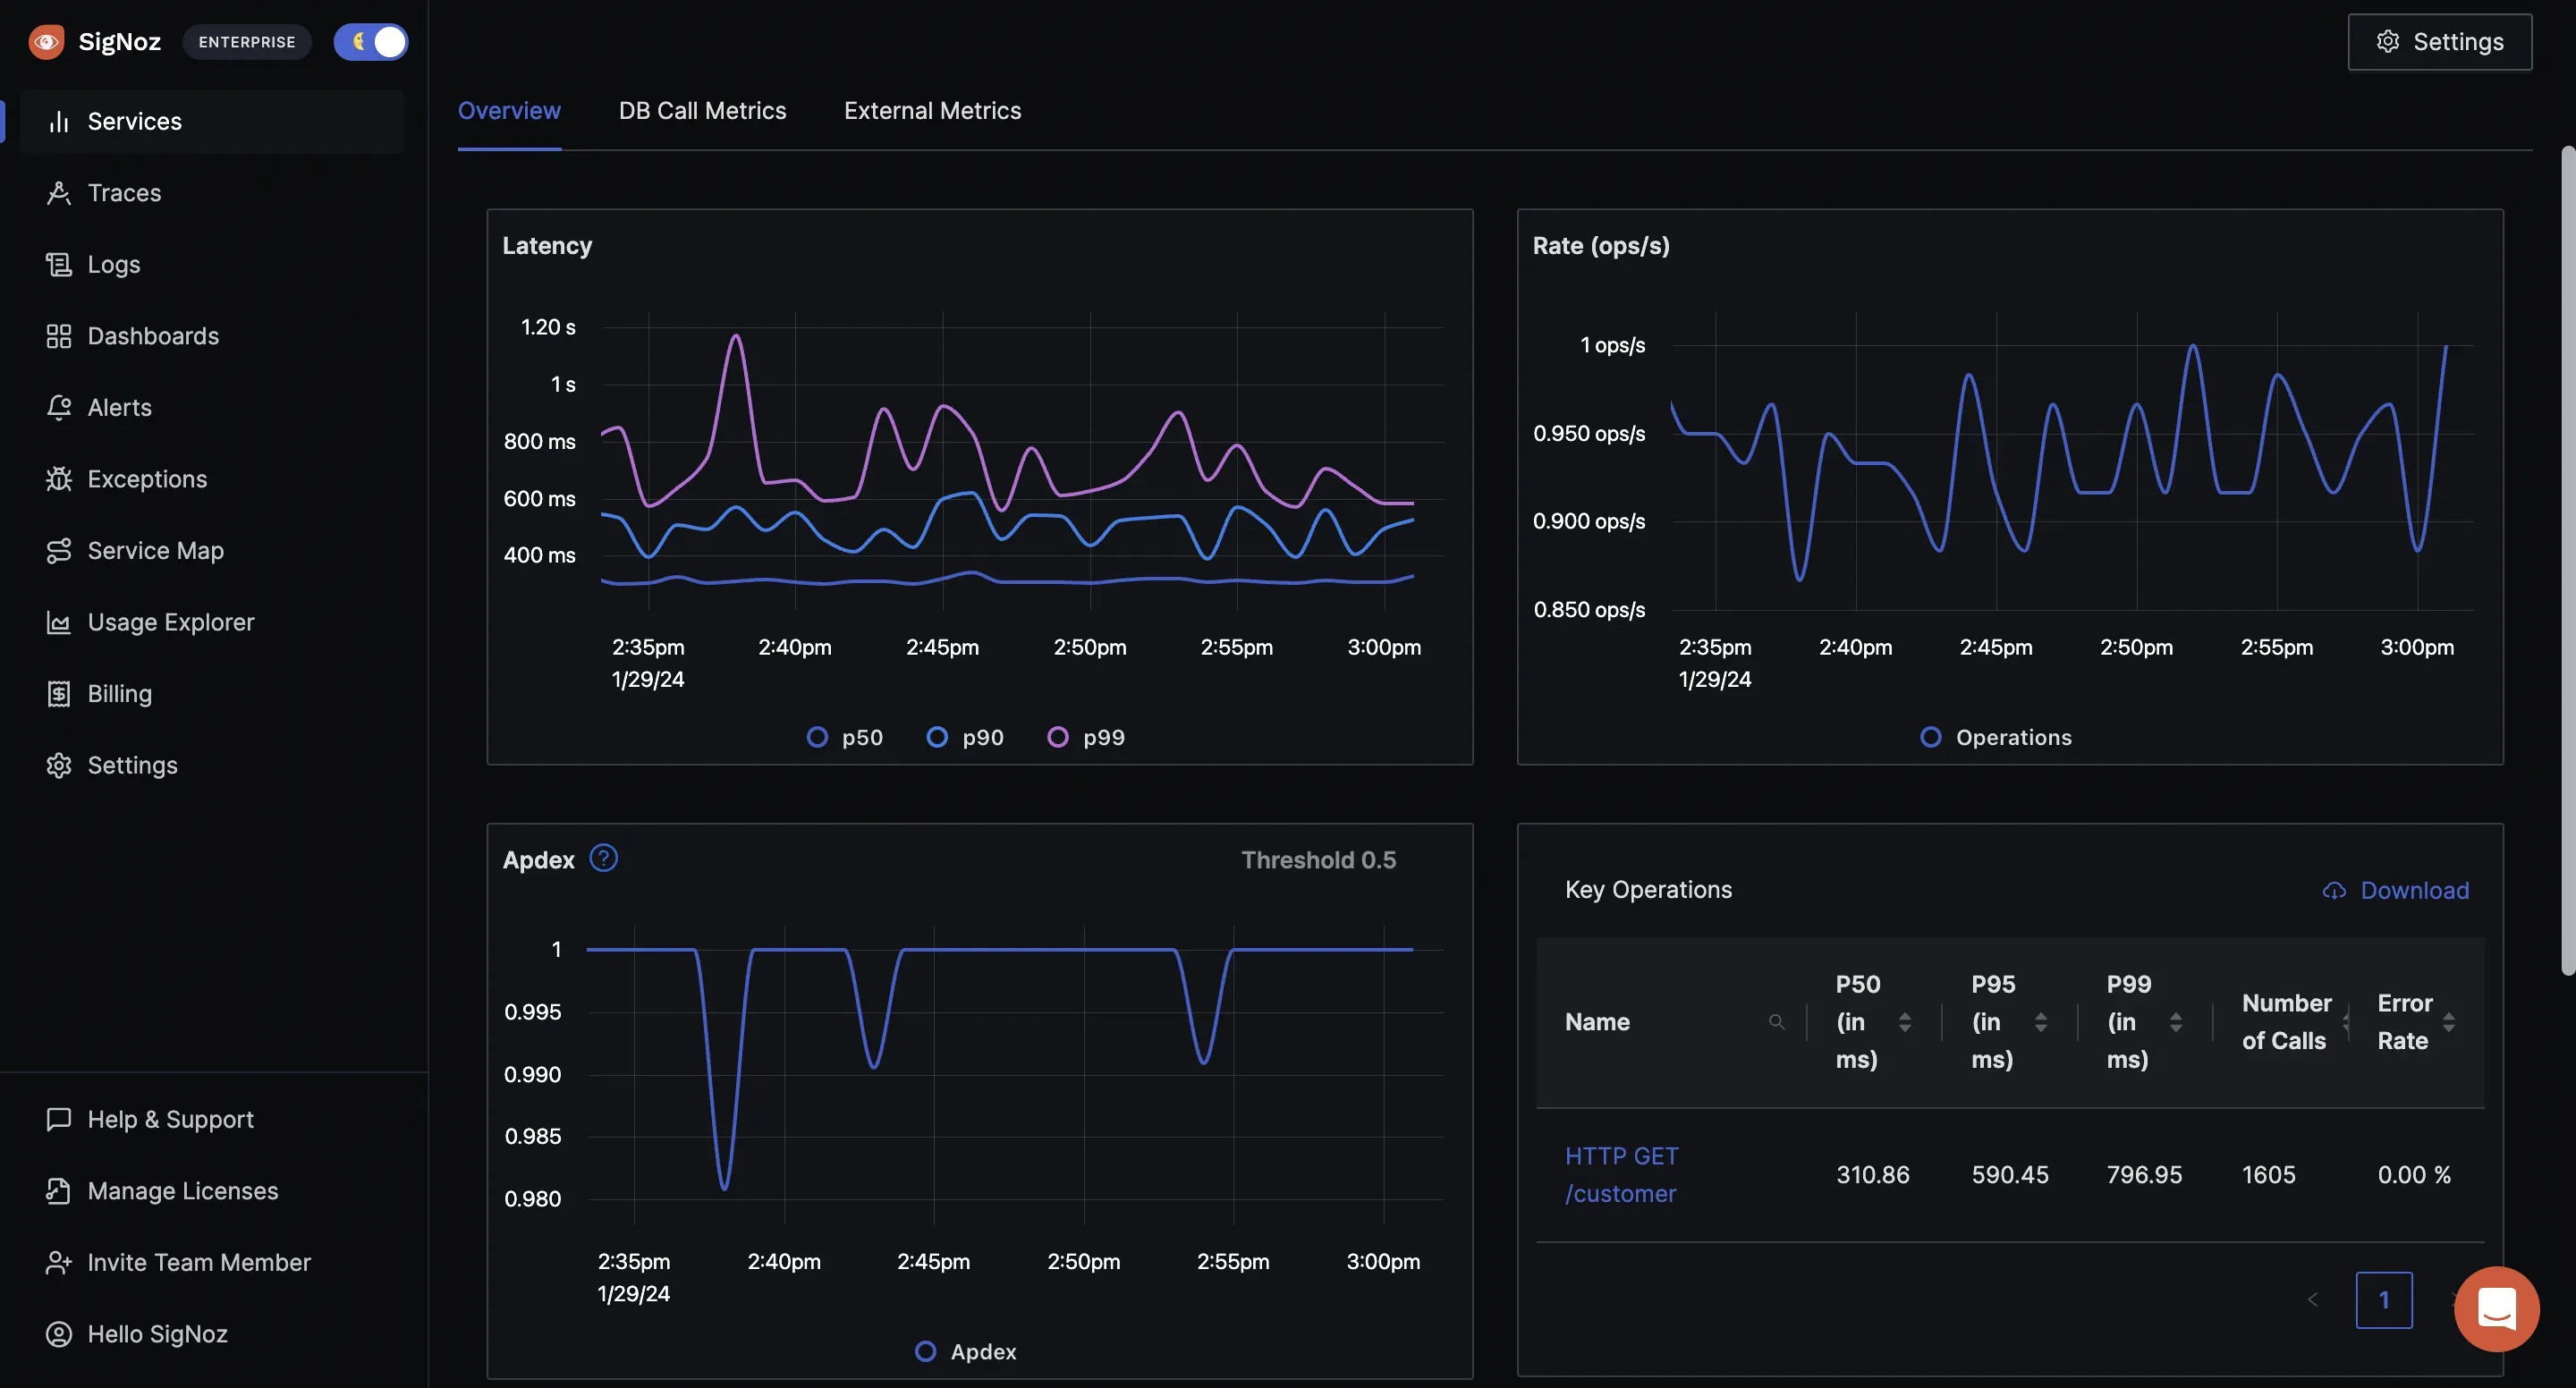
Best for: Application teams seeking a Datadog-style APM workflow with portable OpenTelemetry instrumentation.
SigNoz brings traces, metrics, logs, exceptions, dashboards and alerts into one interface. ClickHouse stores the telemetry, while OpenTelemetry provides the collection path. Service maps, latency views, exceptions and trace-to-log investigation make SigNoz a natural candidate when APM is the main buying requirement.
The repository licenses the community code outside its enterprise directories under MIT. The self-hosted deployment still requires teams to understand ClickHouse capacity, retention and upgrades as volume grows.
Watch for: Confirm which identity, access-control and support features belong to the community or commercial edition. Include ClickHouse operations in the ownership estimate rather than treating SigNoz as a maintenance-free appliance.
4. OpenObserve
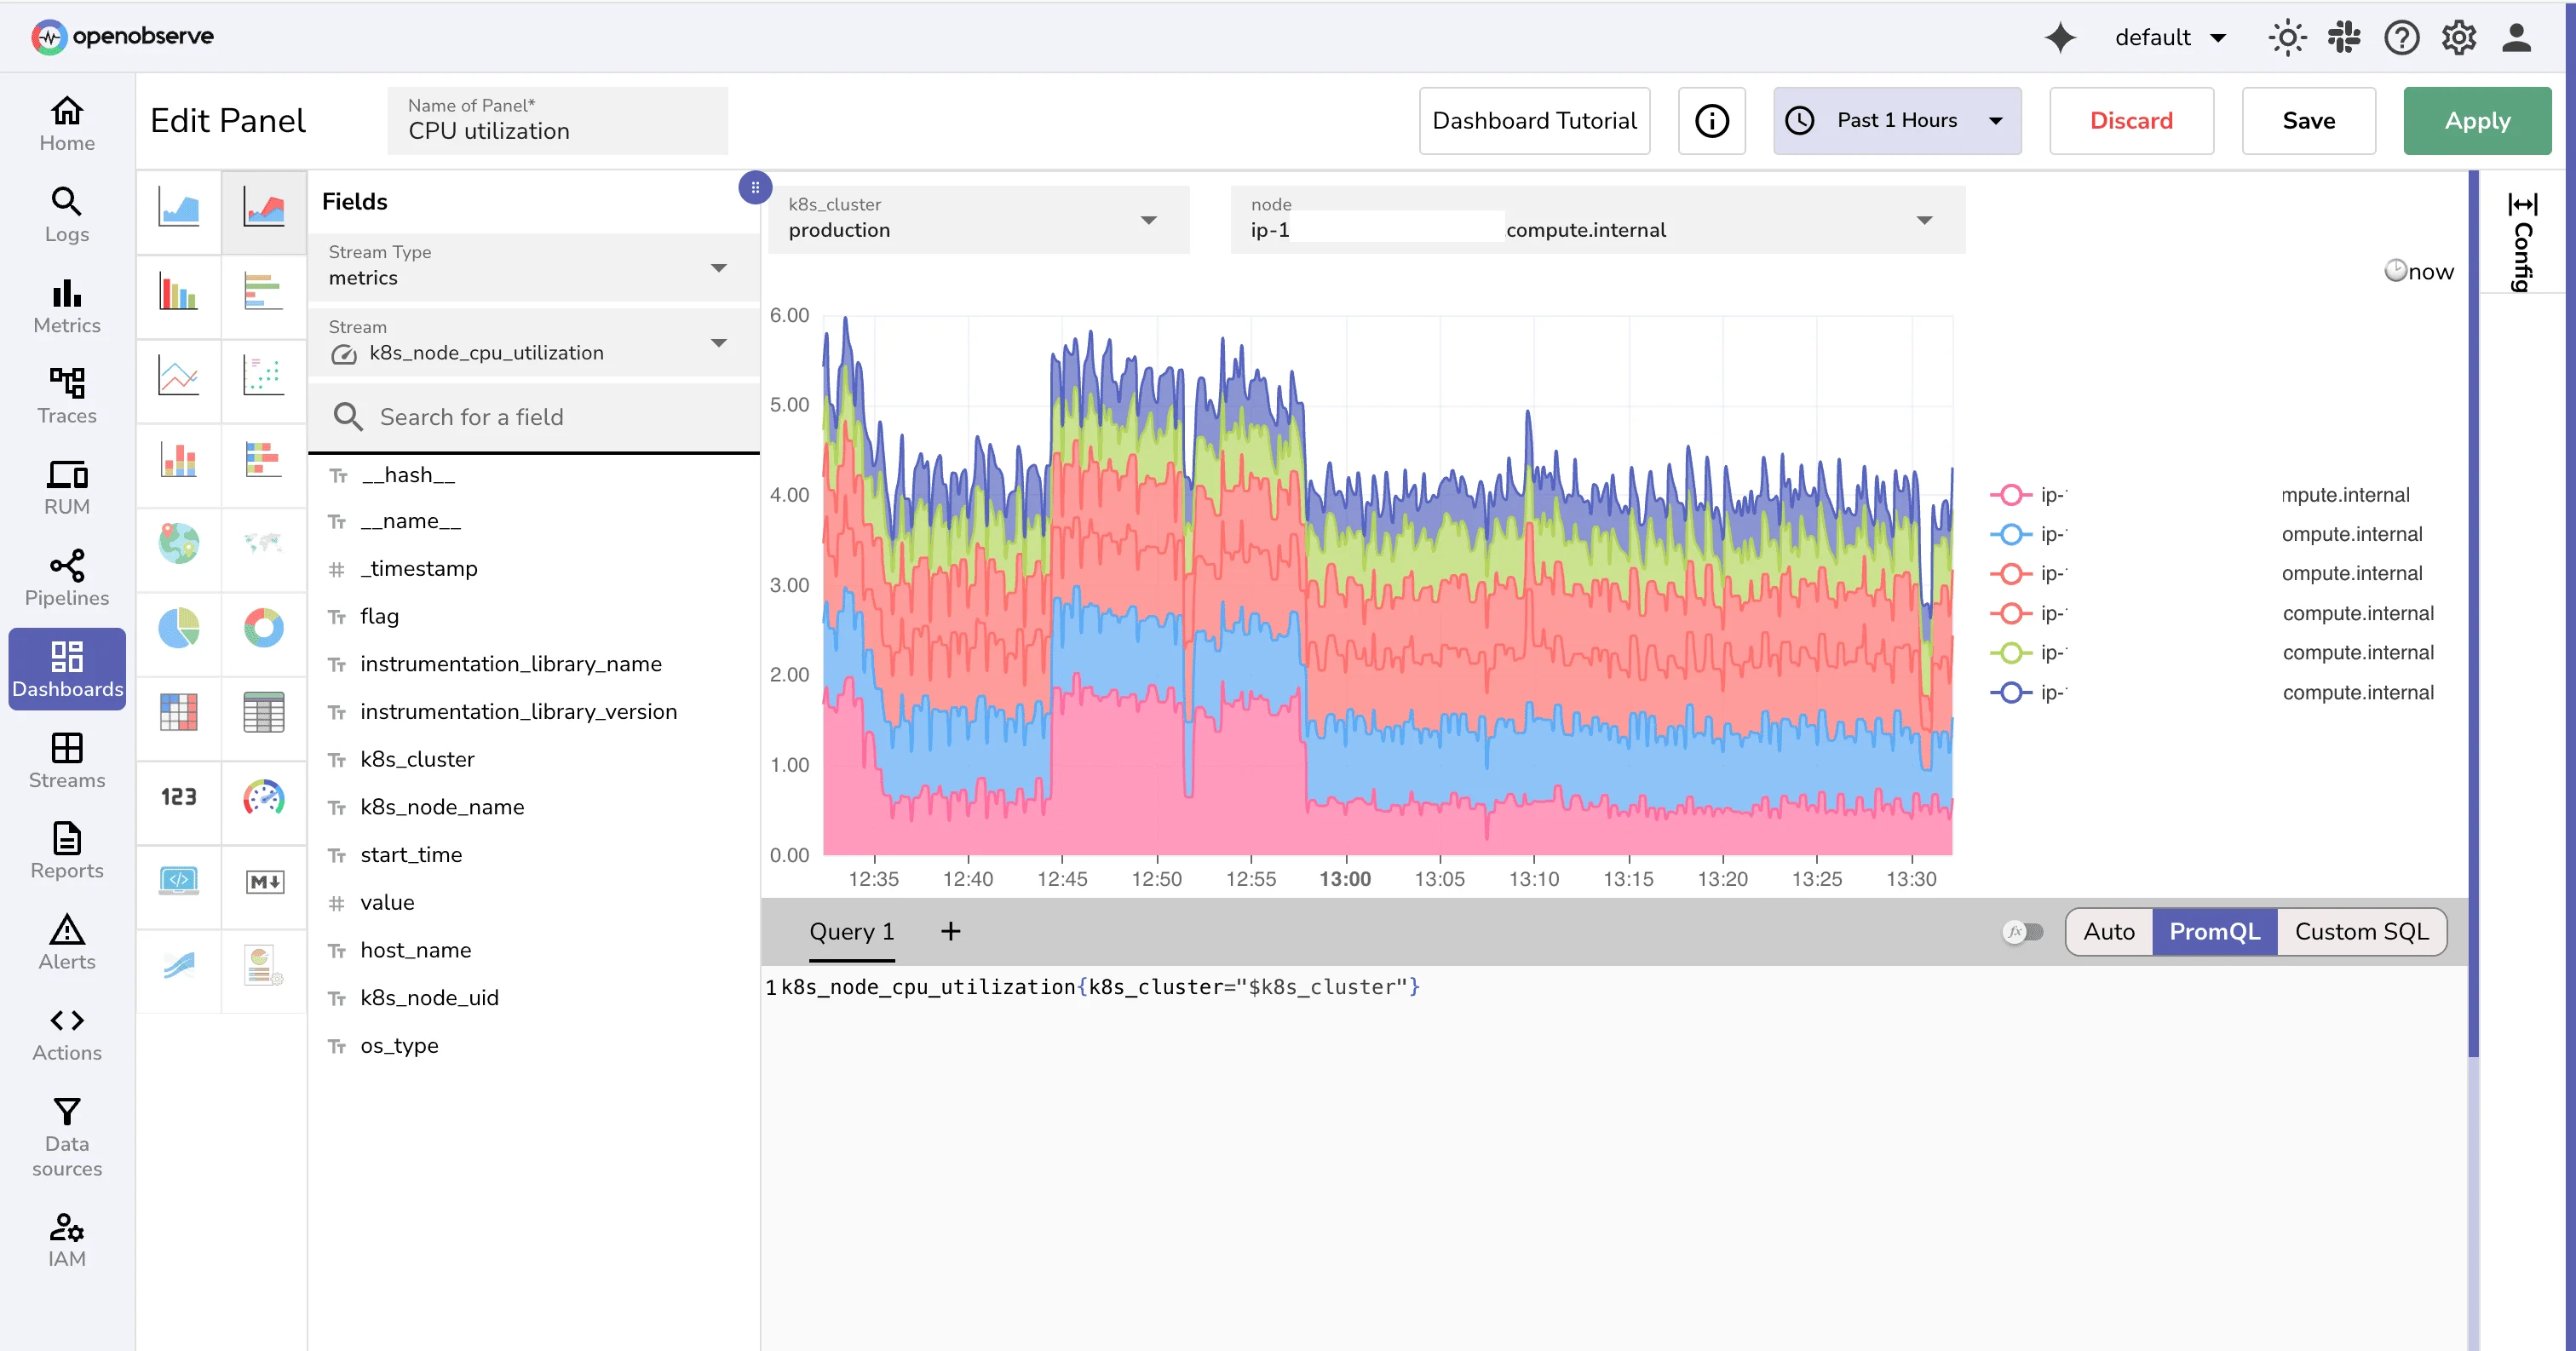
Best for: Teams prioritizing log search, long retention and S3-compatible storage in a compact deployment.
OpenObserve is a Rust-based platform for logs, metrics, traces, frontend monitoring, dashboards and alerts. It writes data in Parquet format and can use object storage, which makes it attractive for teams moving away from index-heavy log architectures. Its query options include SQL for logs and PromQL for metrics.
OpenObserve is broader than a log server, but logs remain its clearest strength. Evaluate trace navigation, dashboard ergonomics and alert behavior against the workflows your on-call team uses most often.
Watch for: The project is AGPL-3.0 and its ecosystem is smaller than Grafana's. Treat vendor-published compression or cost comparisons as starting hypotheses, then test them with your event shape and retention policy.
5. ClickStack: Best ClickHouse-powered open-source observability stack
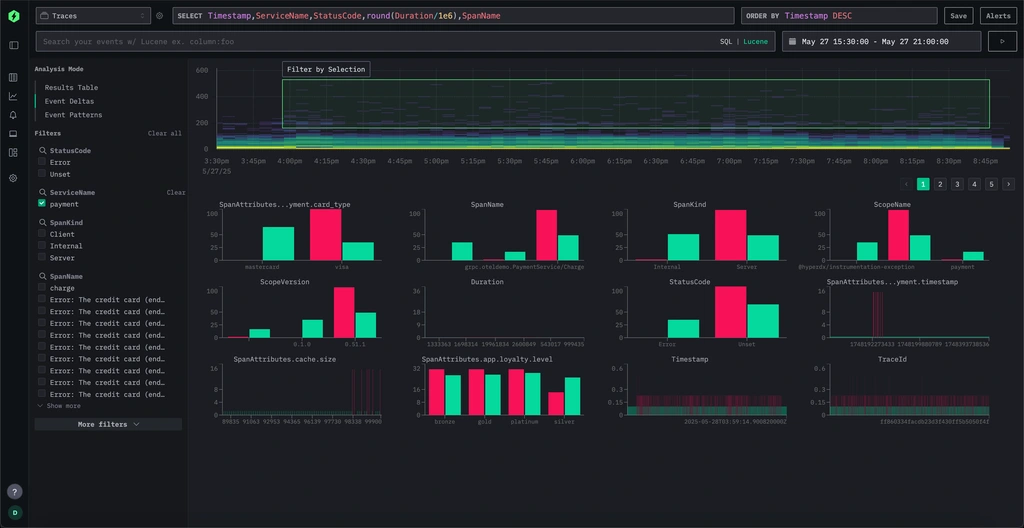
Best for: Teams that want ClickHouse, OpenTelemetry and HyperDX assembled into a documented stack.
ClickStack packages ClickHouse, HyperDX, an OpenTelemetry Collector distribution and supporting components. It covers logs, metrics, traces, errors and session replay. The combination is useful when telemetry already lives in ClickHouse or when the team wants SQL access to high-volume events.
ClickStack and HyperDX are related choices, not independent storage architectures. HyperDX supplies the main investigation experience inside ClickStack. Choose ClickStack when you want the complete bundle and deployment guidance; evaluate HyperDX directly when the UI is the main requirement and you already operate ClickHouse.
Watch for: “Open source” applies per component. ClickHouse and the collector use Apache-2.0, while HyperDX uses MIT. Capacity planning still requires ClickHouse knowledge, especially for retention, merges and high-cardinality data.
6. HyperDX
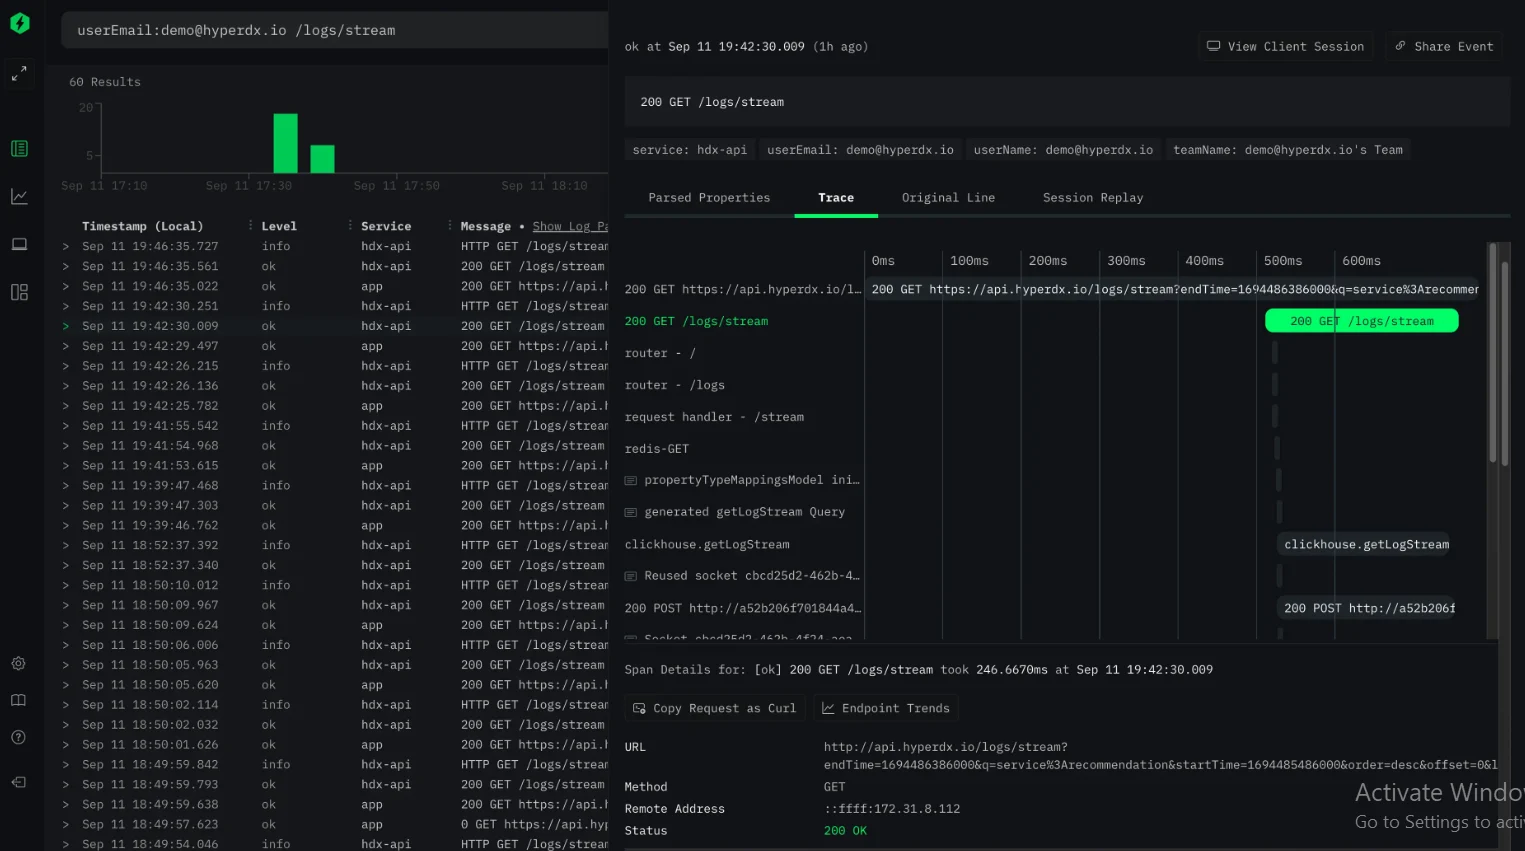
Best for: Product teams that value full-text event search, trace correlation and session replay on ClickHouse.
HyperDX unifies logs, metrics, traces, errors and browser sessions in a debugging-oriented interface. Engineers can search events, pivot through correlated fields and connect a frontend session to backend telemetry. This makes it useful when a conventional infrastructure dashboard cannot reproduce a user's failure.
HyperDX is now a core part of ClickStack. Listing it separately here reflects how teams search and evaluate the project, not a claim that it is a separate end-to-end backend. A team starting from zero should compare the complete ClickStack deployment; a team with ClickHouse should focus on the HyperDX workflow.
Watch for: Verify the supported schema and collector pipeline for each signal. Session replay also introduces privacy, sampling and data-retention decisions that do not apply to infrastructure metrics alone.
7. OpenSearch Observability: Best for teams already running OpenSearch
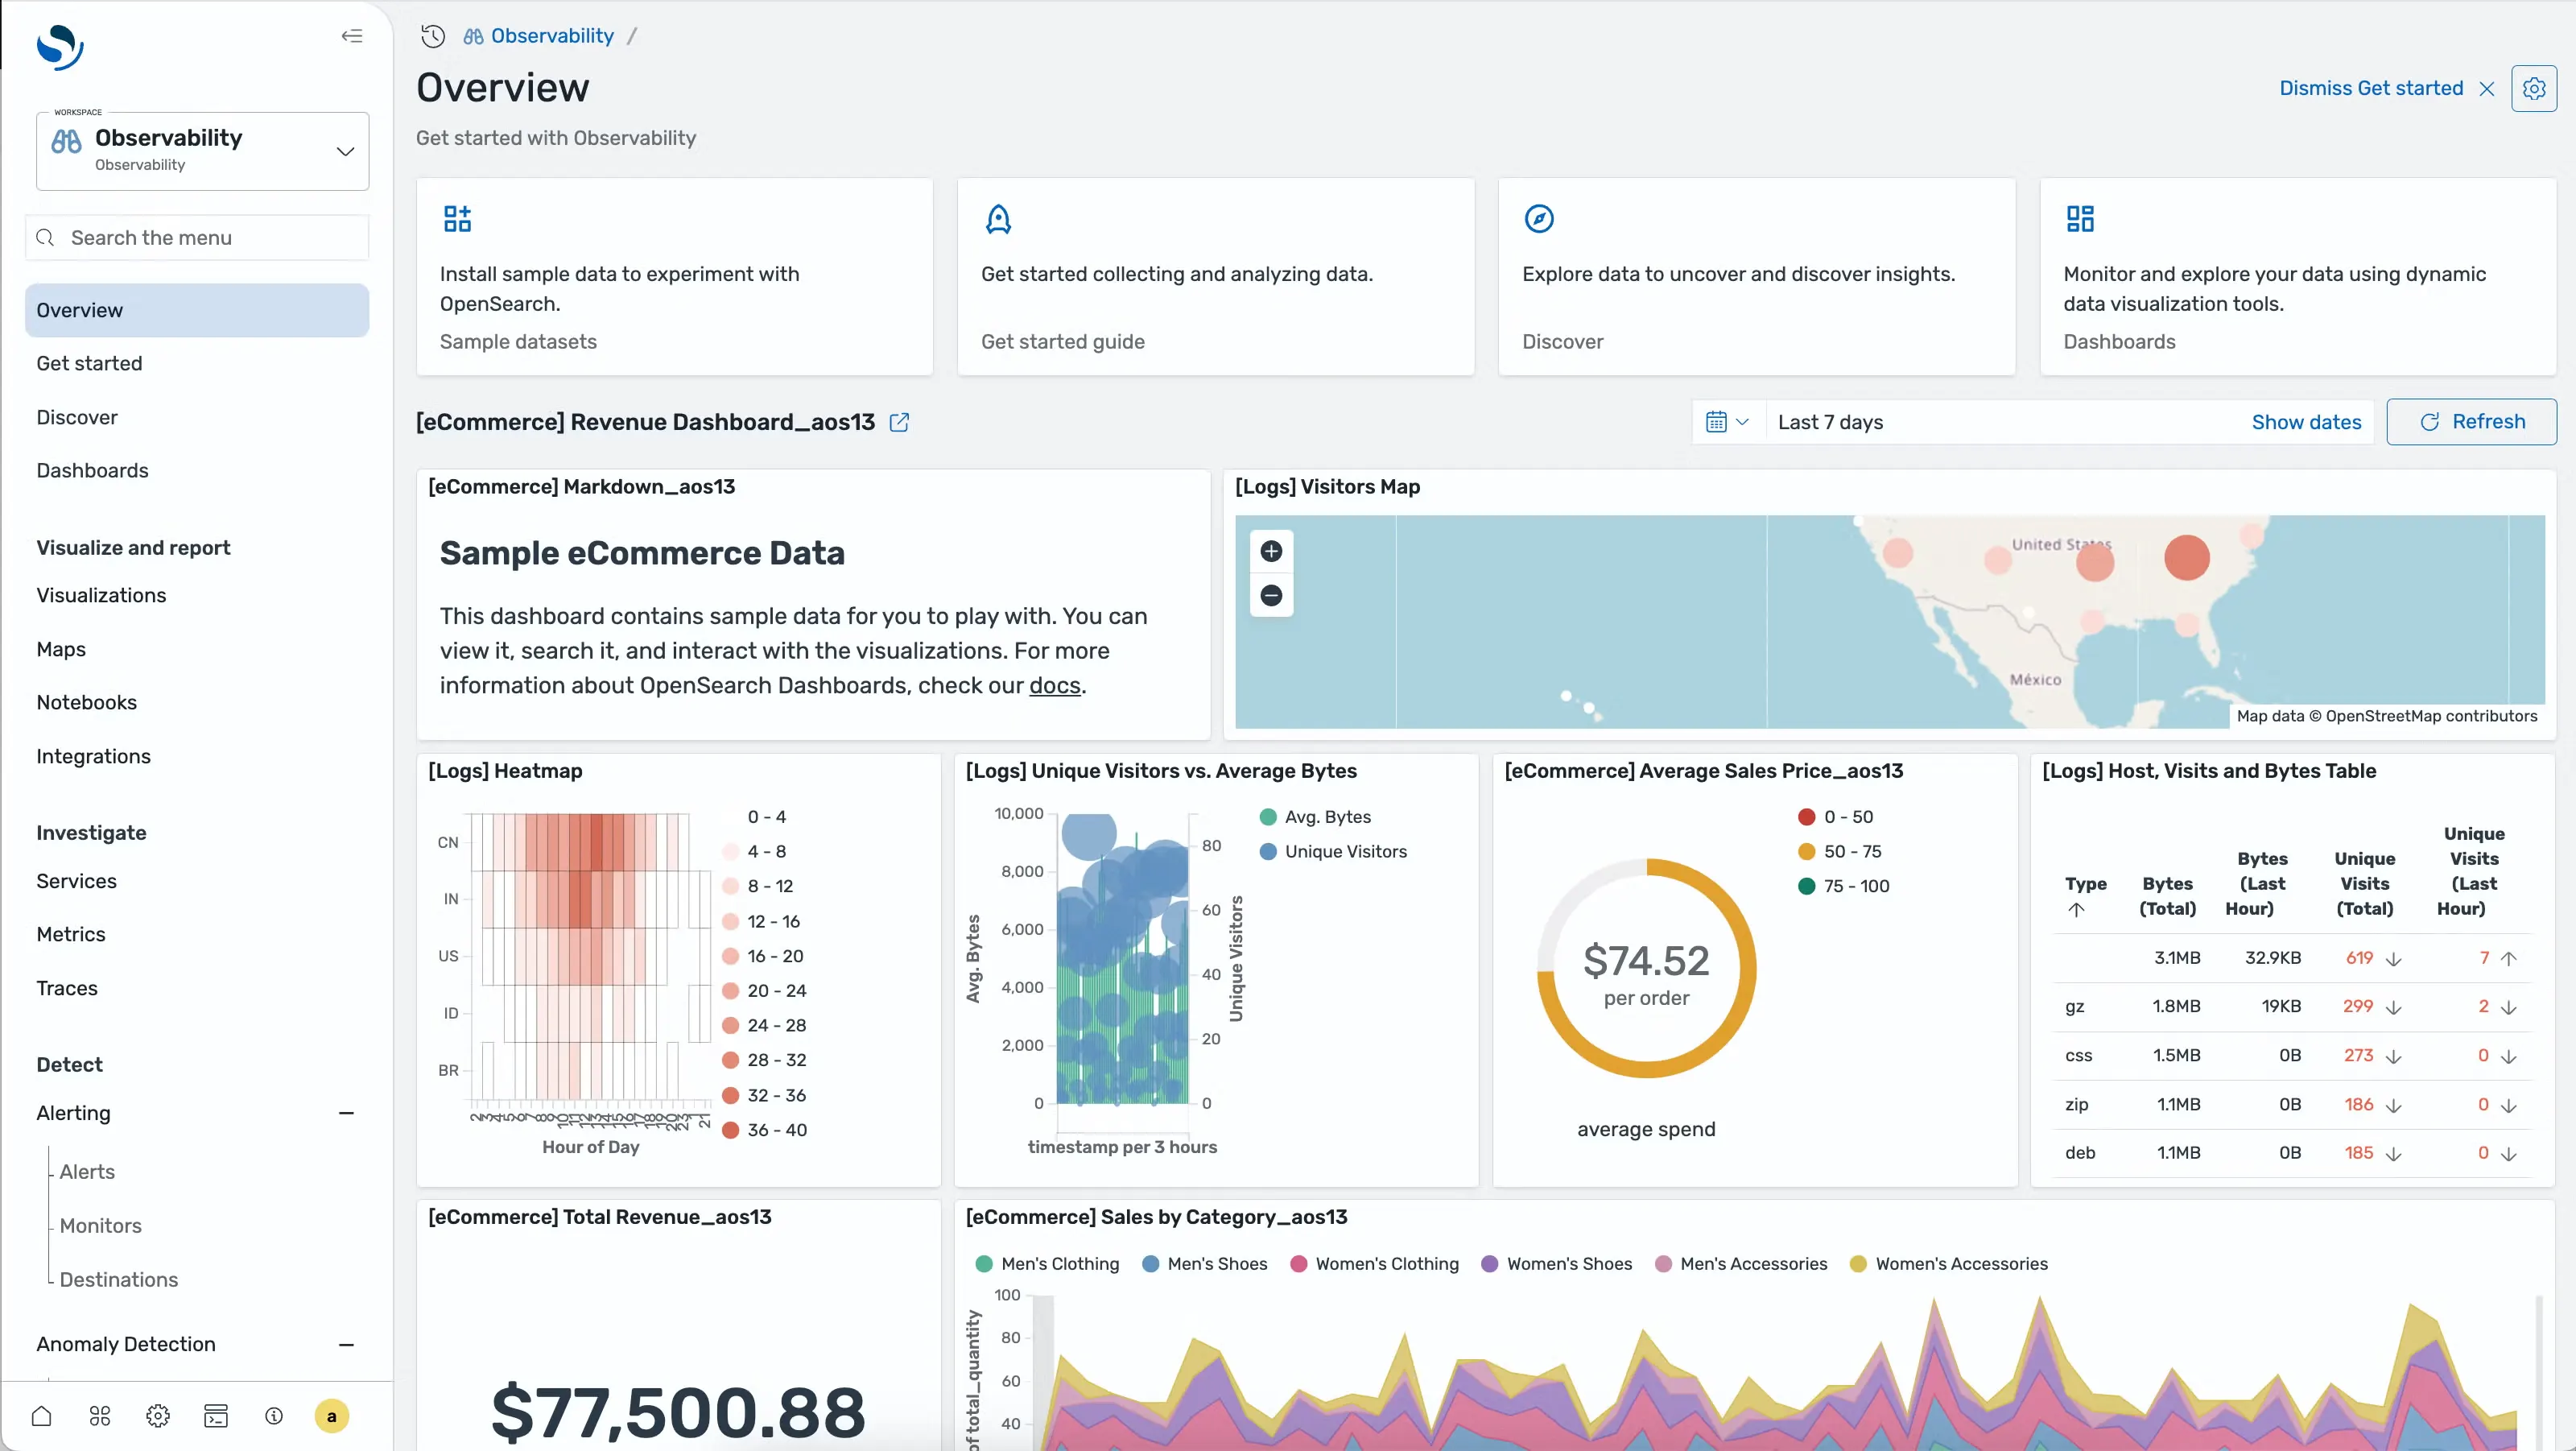
Best for: Organizations that already operate OpenSearch and want to keep logs and trace analysis in that environment.
OpenSearch Observability adds dashboards, event analytics, trace analytics and integrations around the Apache-2.0 OpenSearch project. It is compelling when the organization already has cluster expertise, security policies, snapshots and ingestion pipelines built around OpenSearch.
Search-oriented storage remains flexible for unstructured logs, but clusters demand deliberate shard sizing, lifecycle management and JVM capacity. Adding observability to an existing healthy cluster is a different proposition from deploying OpenSearch solely to replace a simpler telemetry backend.
Watch for: Model hot, warm and deleted data before migration. A familiar interface does not remove the storage and operational cost of indexes at high ingest rates.
8. Apache SkyWalking
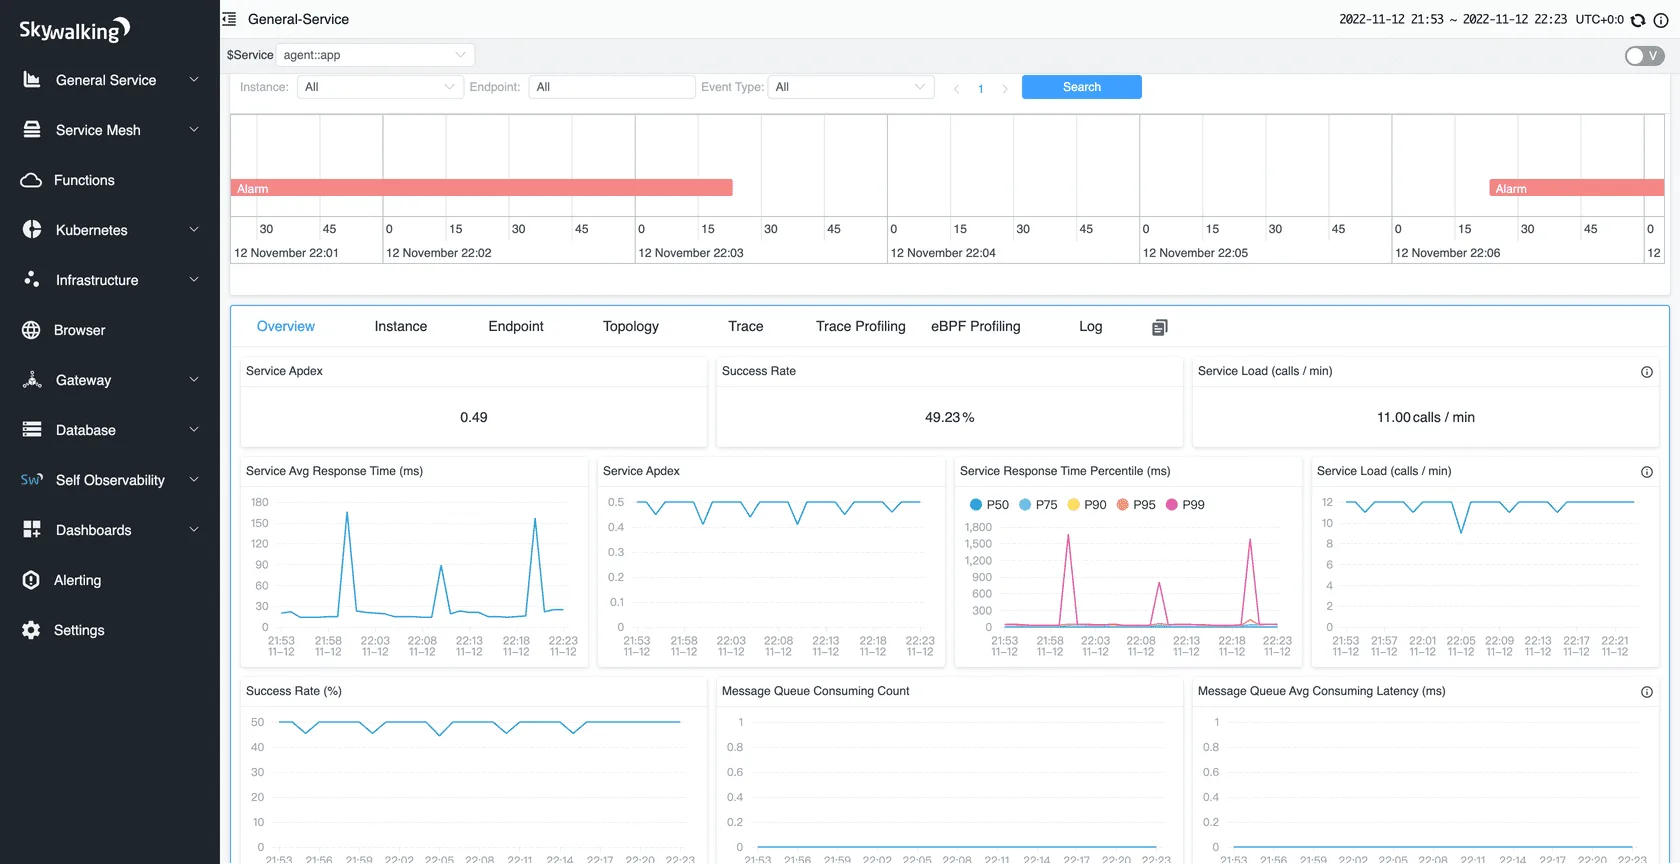
Best for: Large distributed systems where service topology, Java agents and trace analysis matter more than general-purpose log search.
Apache SkyWalking is an Apache-2.0 APM platform for services, cloud-native infrastructure, containers and service meshes. Its Observability Analysis Platform builds service relationships and performance views from traces and metrics. SkyWalking supports OpenTelemetry alongside its own agents and protocols.
Its architecture and domain model reward teams with a clear tracing requirement. Teams mainly seeking centralized logs may find a logs-first platform easier to operate and teach.
Watch for: Validate storage backend sizing and the learning curve of SkyWalking's concepts and query language. Its breadth is useful, but setup is less product-like than a single-node evaluation might suggest.
9. VictoriaMetrics Stack: Best open-source observability stack for metrics-heavy teams
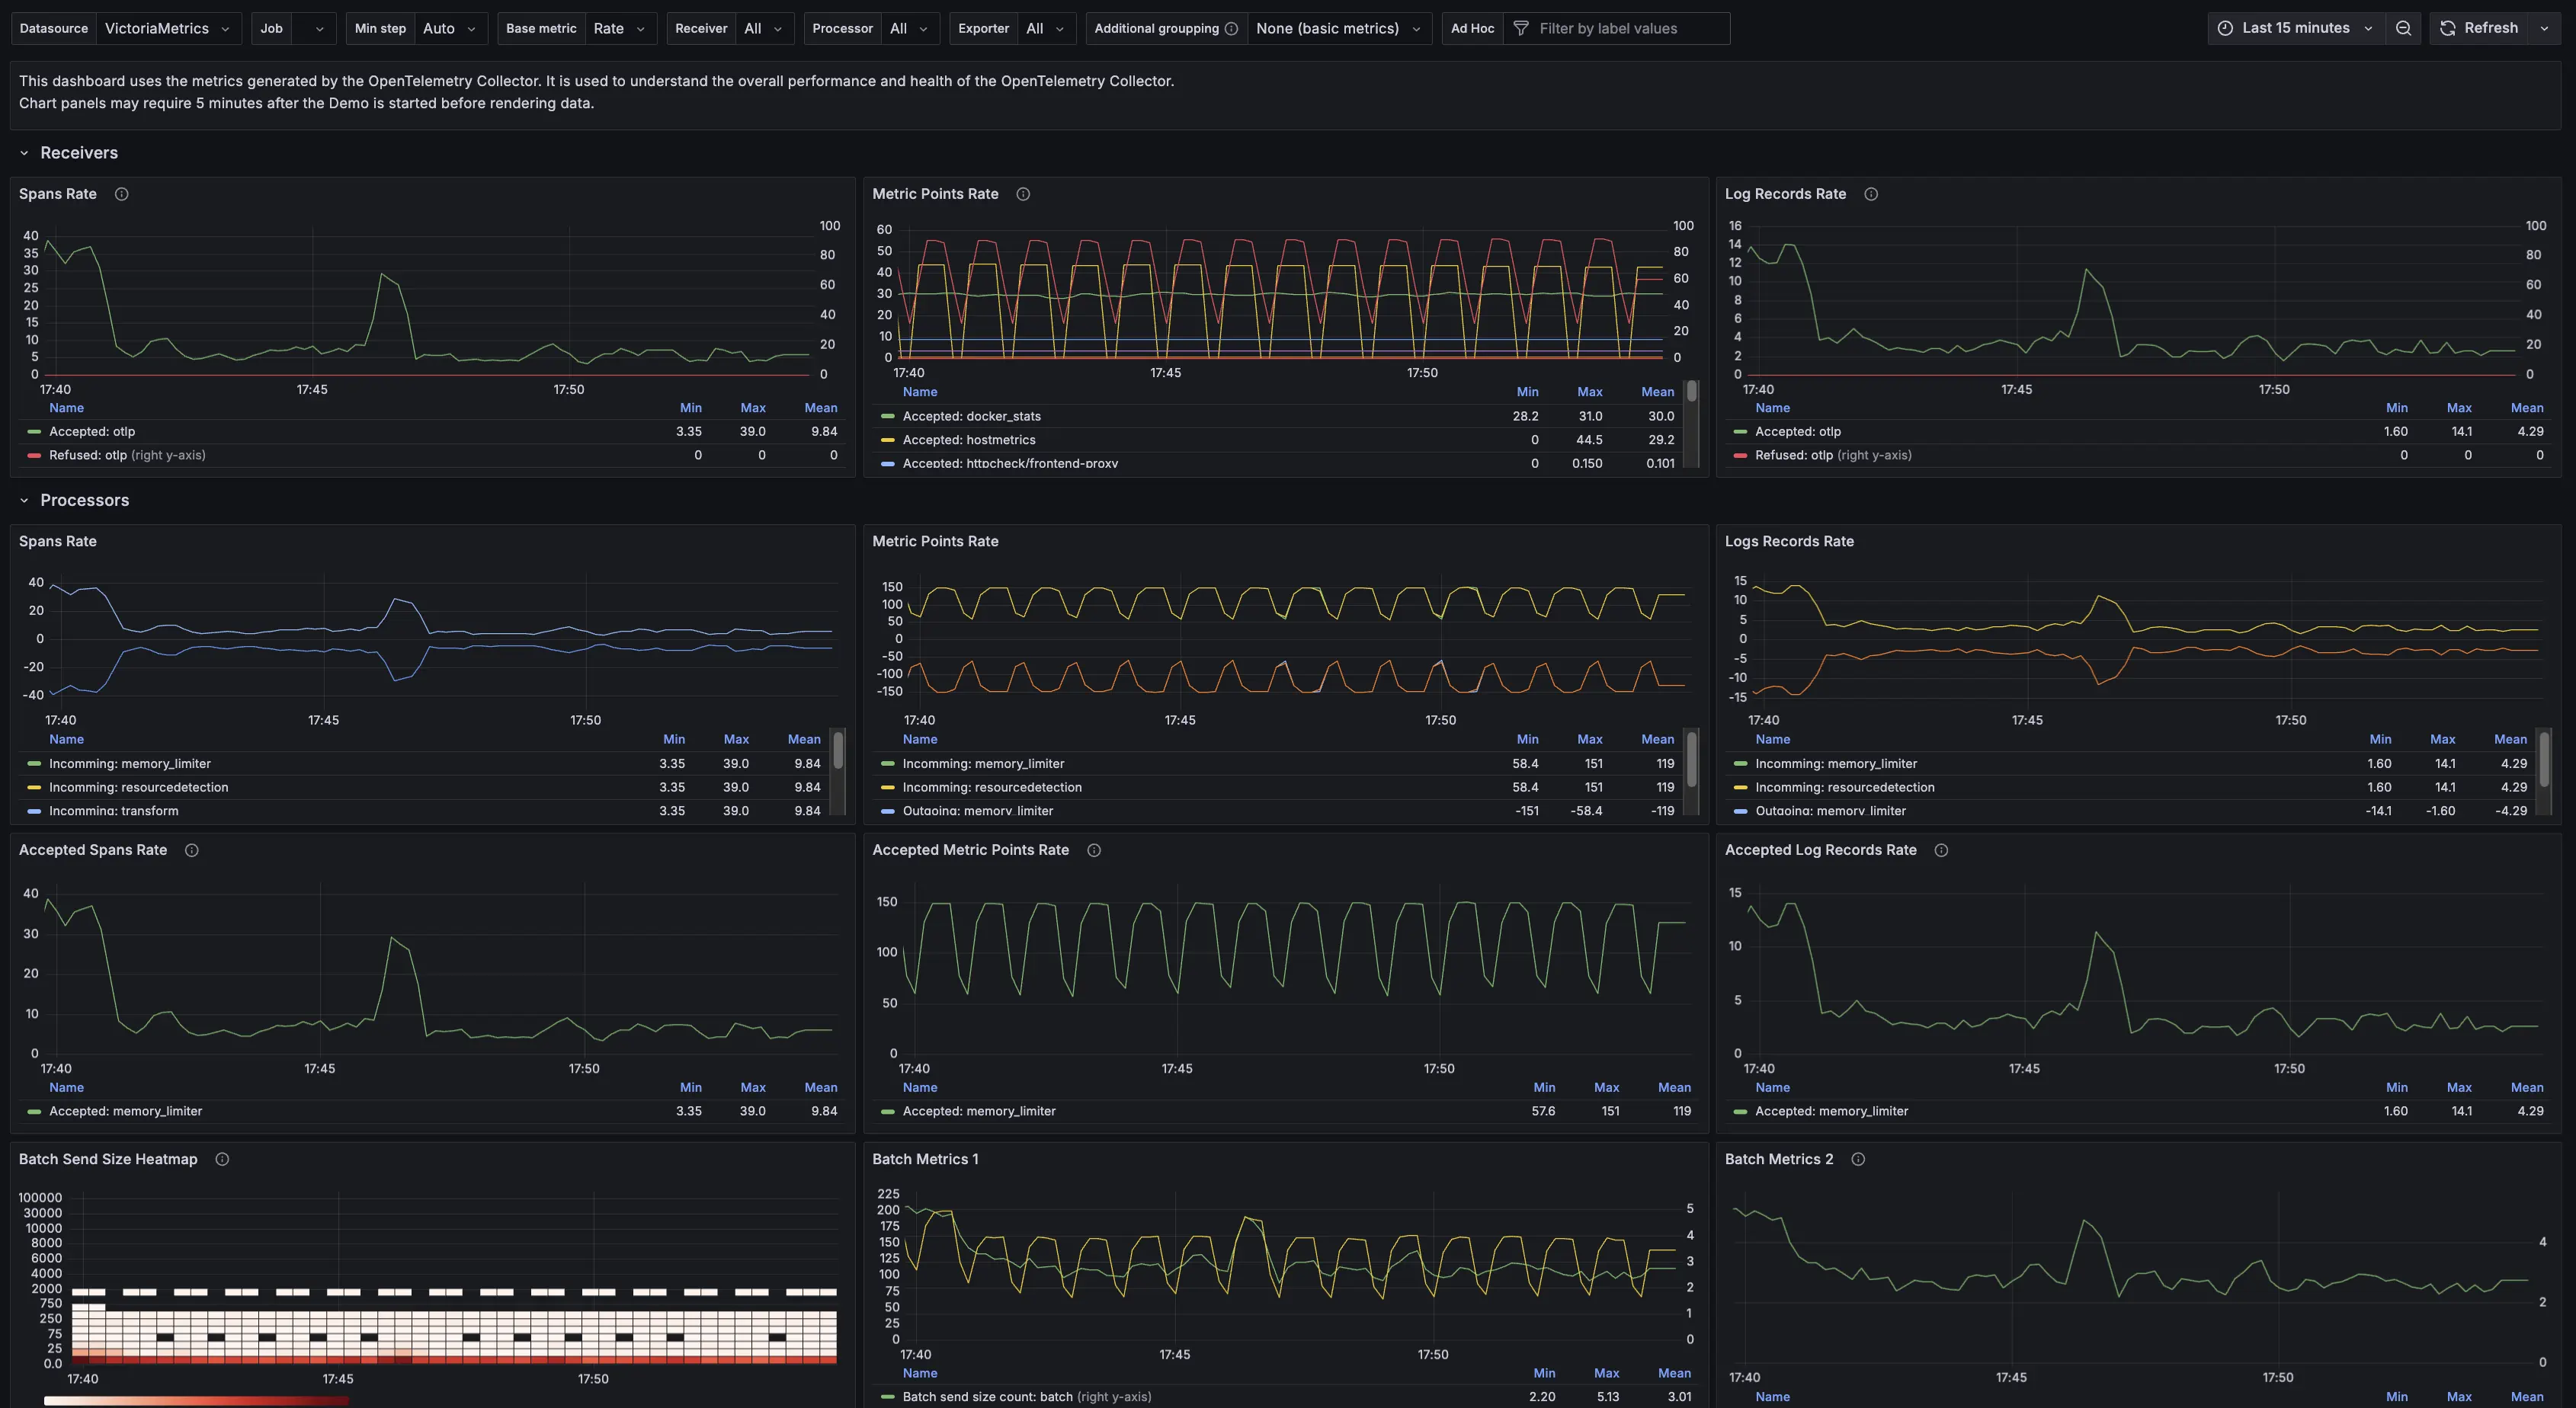
Best for: Prometheus-compatible metrics workloads where ingestion efficiency and long retention are the priority.
VictoriaMetrics is primarily a time-series database and monitoring system. VictoriaLogs extends the vendor's stack into log management, while Grafana commonly provides dashboards. MetricsQL builds on PromQL and gives Prometheus users a familiar migration path.
VictoriaMetrics belongs on the shortlist when metrics dominate the workload and the team is comfortable composing adjacent tools. Unlike Parseable or SigNoz, it does not unify logs, metrics and traces in one product.
Watch for: Distributed tracing needs another backend. Price and operate that missing layer when comparing the VictoriaMetrics stack with a platform that includes traces.
10. Uptrace
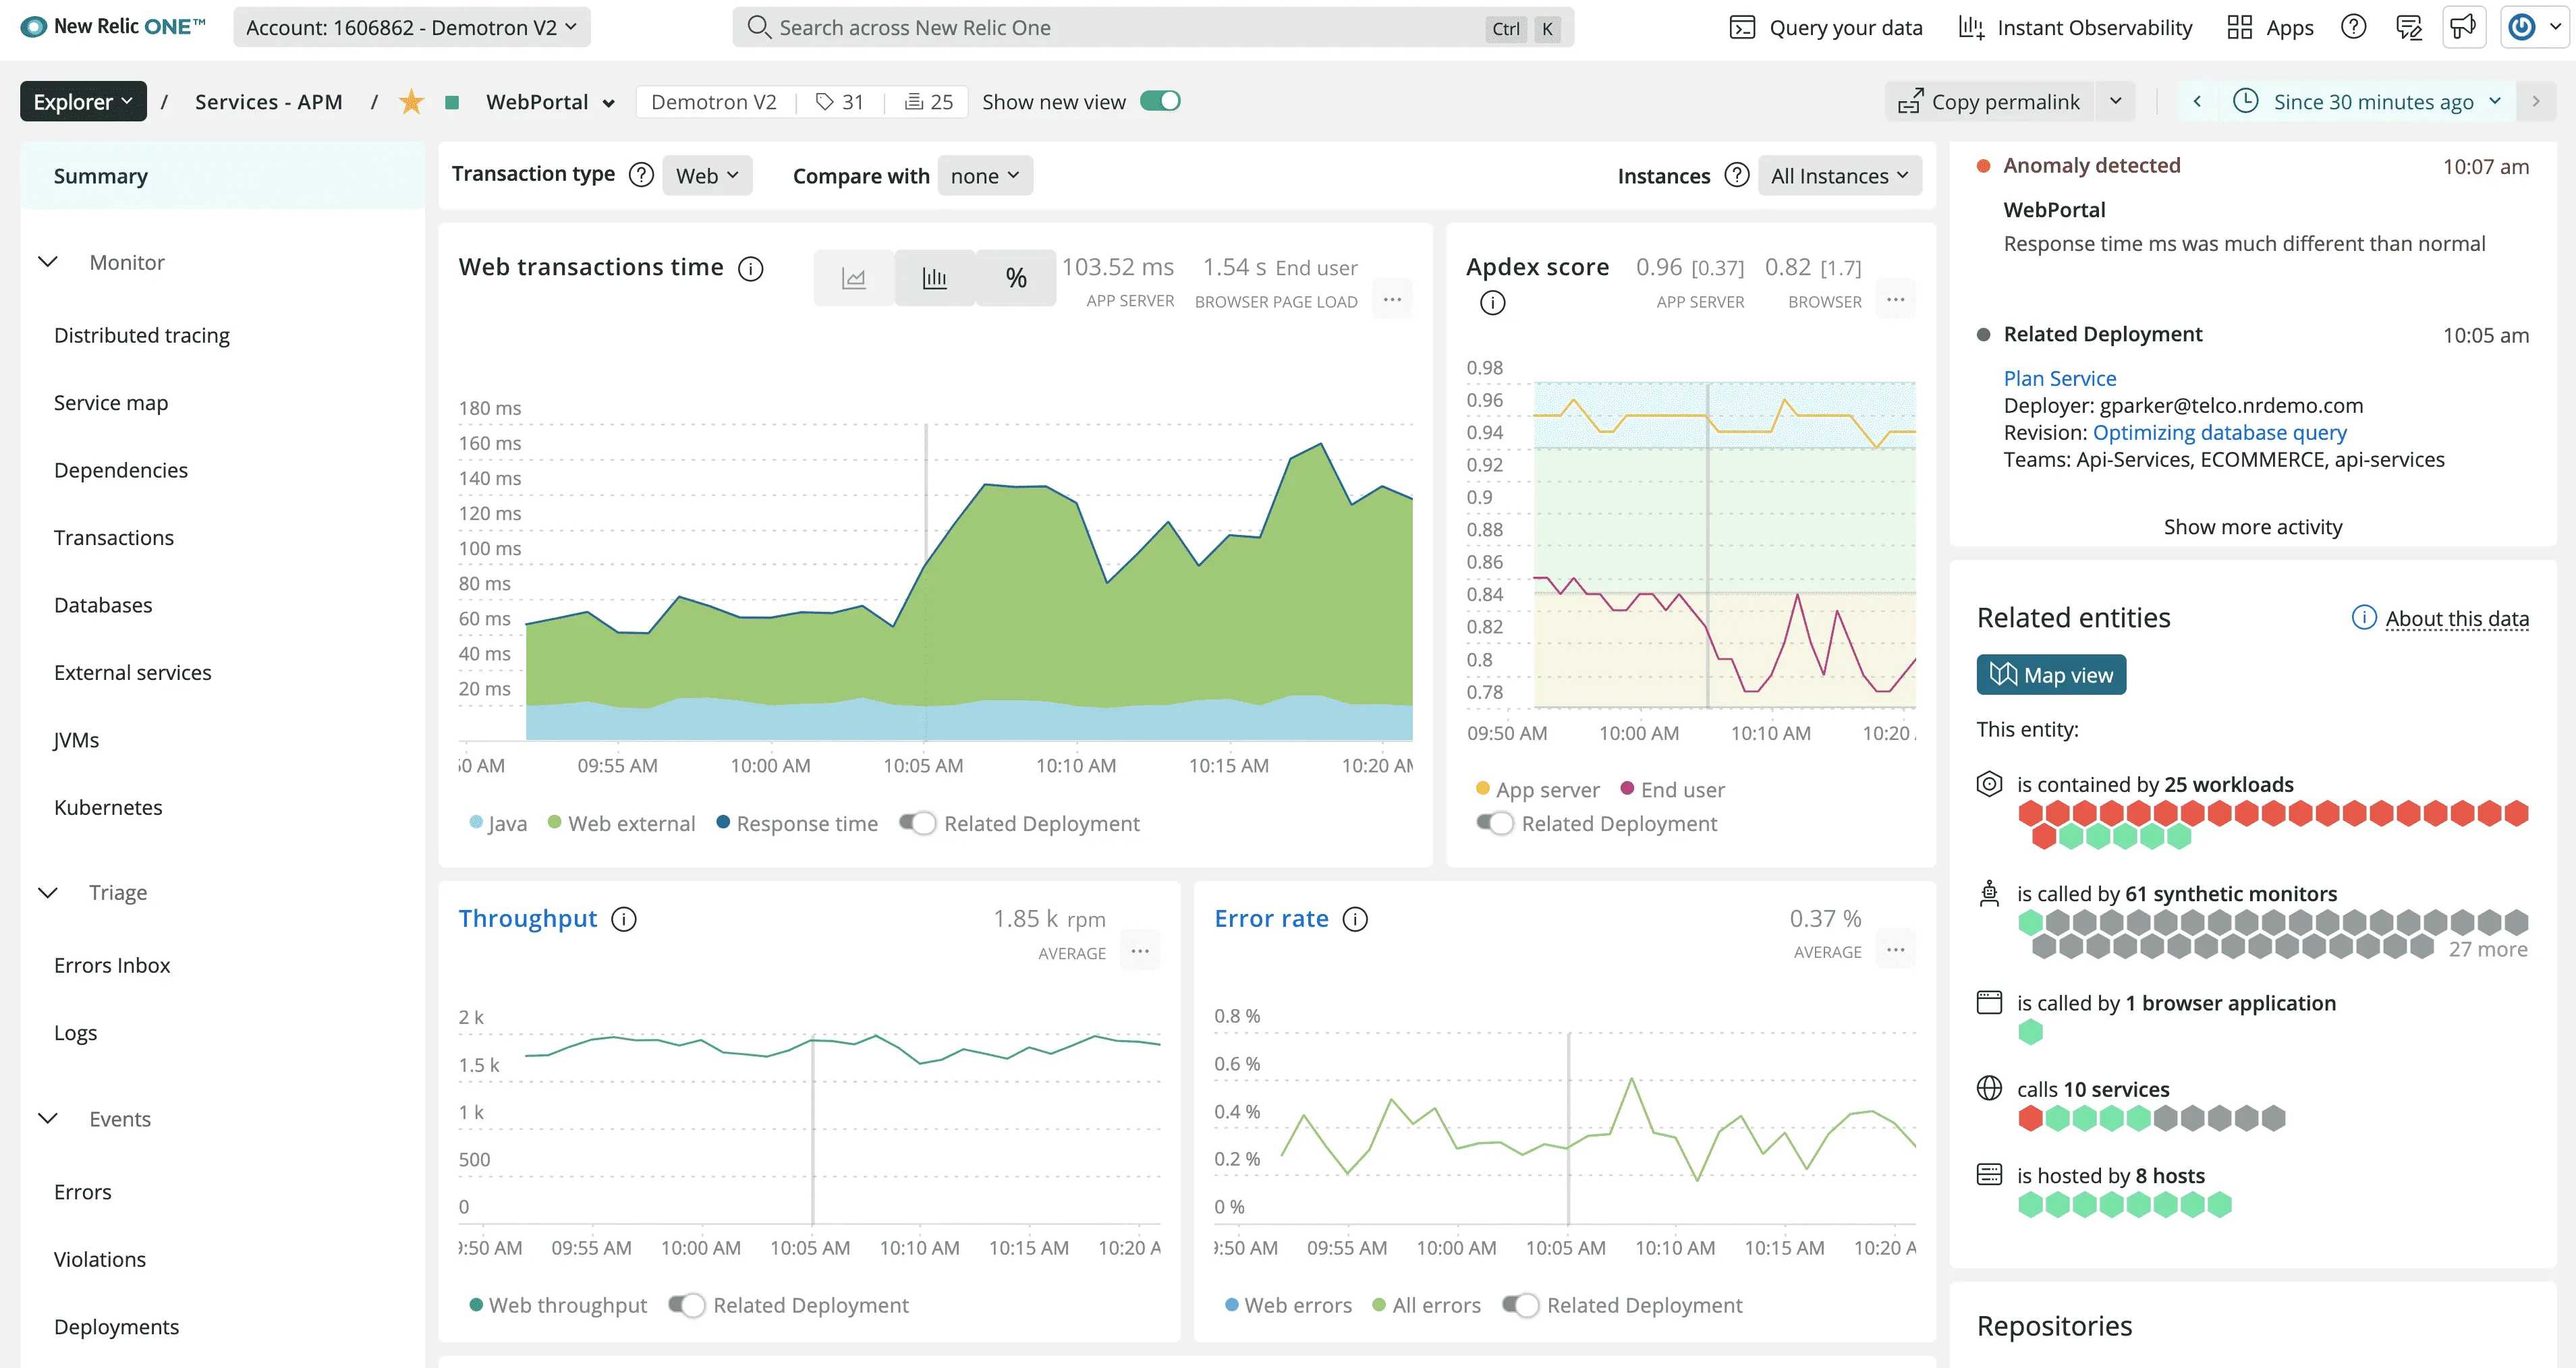
Best for: Smaller teams that want a self-hosted OpenTelemetry APM with a strong trace workflow.
Uptrace supports traces, metrics and logs with dashboards, alerts, service graphs and a query builder. It stores telemetry in ClickHouse and keeps metadata in PostgreSQL. The product is approachable for teams that want more than a trace viewer but do not need the breadth of a large composable stack.
The current repository uses AGPL-3.0. Older comparisons may describe a different license, so use the repository rather than third-party tables when performing legal review.
Watch for: Operating two databases adds backup and upgrade work. Test log search and cross-signal navigation if the use case extends beyond APM.
Which open-source observability platform should you choose?
Use the operational shape to build the shortlist:
| If your priority is... | Shortlist... | Validate first... |
|---|---|---|
| One product for logs, metrics and traces | Parseable, SigNoz, OpenObserve | Cross-signal navigation and retention cost |
| Object storage and long retention | Parseable, OpenObserve | Query latency on recent and older data |
| Existing Prometheus and Grafana skills | Grafana LGTM, VictoriaMetrics | Component count and on-call ownership |
| ClickHouse and session replay | ClickStack, HyperDX | Schema, privacy controls and merge load |
| Existing OpenSearch operations | OpenSearch Observability | Shard growth and lifecycle policy |
| Service topology and tracing | SkyWalking, Uptrace, SigNoz | Instrumentation coverage and sampling |
For a large-scale deployment, narrow the field before benchmarking. Run the same OpenTelemetry stream into each finalist, reproduce common incident queries, stop a storage or ingest node and measure recovery. A platform that wins a synthetic ingest test can still lose if upgrades or investigations require specialist knowledge.
Platform or stack?
Choose a unified observability platform when a small team owns the whole system and wants one upgrade path. Choose a composed open-source observability stack when the organization already operates its components, needs to replace them independently, or has signal-specific scale requirements.
Self-hosted or managed?
Self-hosting gives you control over data location and infrastructure, but the software license is only one line in the cost model. Include compute, storage, backups, upgrades, security patches and engineer time. A managed service can be cheaper when it removes enough operational work; self-hosting can be cheaper when data volume is high and the team already runs the underlying systems.
For platforms with commercial editions, compare the community feature set with the controls you need in production. SSO, audit logs, granular RBAC and support often determine the real deployment choice.