

Traefik is a cloud native reverse proxy and ingress controller used to route traffic into Kubernetes services. It sits at the edge of the application path, so it sees the request before most application code does.
That also makes Traefik one of the first places where a production problem leaves a clear trace. It terminates TLS, chooses a router and service, forwards the request and records the response. When traffic starts failing at the edge, Traefik usually has the first useful evidence.
Imagine a checkout API that starts returning intermittent 502 responses. The pods remain ready. CPU usage looks normal. Traefik still accepts traffic, so a basic uptime check reports no problem. The failure becomes much easier to reason about when you can compare the error rate with service latency and inspect access logs for the route and backend involved.
This post walks through a Kubernetes setup where Traefik exposes Prometheus metrics, writes JSON logs and exports traces over OTLP. An OpenTelemetry Collector receives the data and forwards it to Parseable. From there, you can measure the 5xx spike, find the requests behind it and follow one of those requests into the backend. A dashboard gives the team the same view while the incident is still fresh.
Architecture
The separation is intentional. Traefik produces the telemetry, but it does not need to know how Parseable is deployed or where each dataset lives. The OpenTelemetry Collector handles Kubernetes discovery, batching, retries and Parseable credentials.
Internet
   |
   v
Traefik on Kubernetes
   |-- JSON system and access logs --> container stdout --> Kubernetes log collector
   |
   |-- Prometheus metrics --> :9100/metrics --|
   |                                          |
   `-- traces --> OTLP HTTP :4318 ------------|--> OpenTelemetry Collector
                                                        |
                                                        v
                                      Parseable
                                      |-- traefik-logs
                                      |-- traefik-metrics
                                      `-- traefik-traces
Each signal lands in its own dataset. Logs remain useful for request-level debugging, metrics stay easy to query with PromQL and traces keep their span structure. You can also give each dataset its own retention and access controls.
Prerequisites
Before you start, make sure you have:
- A Kubernetes cluster with Traefik installed through Helm
kubectlandhelmaccess to the cluster- An OpenTelemetry Collector that can discover Kubernetes pods
- A reachable Parseable instance and an API key
Create the traefik-logs and traefik-metrics datasets before sending data. Create traefik-traces when you add end-to-end tracing. You can use Parseable Cloud or a self-hosted deployment.
Step 1: Enable Traefik access logs and metrics
Add the following values to your Traefik Helm configuration:
log:
  format: json
  level: INFO

accessLog:
  enabled: true
  format: json
  bufferingSize: 100
  fields:
    headers:
      defaultMode: drop
    queryParameters:
      defaultMode: drop

metrics:
  prometheus:
    entryPoint: metrics
    addEntryPointsLabels: true
    addRoutersLabels: true
    addServicesLabels: true

ports:
  metrics:
    port: 9100
    expose:
      default: false
JSON keeps the request method, path, status code, router, service and duration as queryable fields. The configuration drops headers and query parameters because they often carry cookies, authorization values, or personal data.
The metrics port stays inside the cluster. The Collector can scrape it without exposing a public endpoint.
Apply the values:
helm upgrade --install traefik traefik/traefik \
  --namespace traefik \
  --create-namespace \
  --values traefik-values.yaml
Confirm that Traefik exposes metrics:
kubectl port-forward -n traefik deployment/traefik 9100:9100
curl http://127.0.0.1:9100/metrics | grep traefik_entrypoint_requests_total
Step 2: Collect Traefik system and access logs
Traefik already writes system and access logs to container stdout. A Kubernetes log collector can read /var/log/pods on each node and send records from Traefik pods to traefik-logs, without another exporter inside the pod.
The two log types answer different questions. Access logs show the request method, route, status code and backend. System logs cover startup, configuration reloads and runtime events.
If you collect Kubernetes logs with an OpenTelemetry Collector DaemonSet, select pods carrying this label:
app.kubernetes.io/name=traefikKeep these Kubernetes resource attributes on each record:
k8s.namespace.namek8s.pod.namek8s.container.name
These attributes help when one Traefik replica behaves unlike the others. If the cluster does not have a log pipeline yet, follow the Kubernetes logs with OpenTelemetry Collector guide first.
Step 3: Configure OpenTelemetry for metrics and traces
The Collector has two jobs in this setup. It discovers Traefik pods and scrapes Prometheus metrics from port 9100. It also listens for traces over OTLP HTTP. The signals arrive through different receivers and leave through different exporters, which keeps the datasets easy to reason about.
receivers:
  otlp:
    protocols:
      http:
        endpoint: 0.0.0.0:4318

  prometheus/traefik:
    config:
      scrape_configs:
        - job_name: traefik
          scrape_interval: 15s
          kubernetes_sd_configs:
            - role: pod
          relabel_configs:
            - source_labels:
                - __meta_kubernetes_pod_label_app_kubernetes_io_name
              regex: traefik
              action: keep
            - source_labels: [__meta_kubernetes_pod_ip]
              target_label: __address__
              replacement: $1:9100

processors:
  memory_limiter:
    check_interval: 1s
    limit_mib: 256
  batch: {}

exporters:
  otlphttp/parseable_metrics:
    metrics_endpoint: ${env:PARSEABLE_OTLP_ENDPOINT}/v1/metrics
    encoding: proto
    headers:
      X-API-Key: ${env:PARSEABLE_API_KEY}
      X-P-Stream: traefik-metrics
      X-P-Log-Source: otel-metrics
    retry_on_failure:
      enabled: true
      max_elapsed_time: 0s

  otlphttp/parseable_traces:
    traces_endpoint: ${env:PARSEABLE_OTLP_ENDPOINT}/v1/traces
    encoding: proto
    headers:
      X-API-Key: ${env:PARSEABLE_API_KEY}
      X-P-Stream: traefik-traces
      X-P-Log-Source: otel-traces
    retry_on_failure:
      enabled: true
      max_elapsed_time: 0s

service:
  pipelines:
    metrics/traefik:
      receivers: [prometheus/traefik]
      processors: [memory_limiter, batch]
      exporters: [otlphttp/parseable_metrics]
    traces/traefik:
      receivers: [otlp]
      processors: [memory_limiter, batch]
      exporters: [otlphttp/parseable_traces]
The memory limiter protects the Collector when traffic spikes or Parseable becomes unreachable. The OpenTelemetry memory limiter guide explains how to size its soft and hard limits for production.
Set PARSEABLE_OTLP_ENDPOINT to the Parseable base URL, for example https://demo.parseable.com:8000. Store PARSEABLE_API_KEY in a Kubernetes Secret and inject it into the Collector pod.
The Collector also needs a ServiceAccount that can list and watch pods. The Prometheus receiver cannot discover Traefik without that permission. If you plan to collect traces, expose port 4318 on the Collector's Kubernetes Service and keep it inside the cluster.
Check the Collector after applying the configuration:
kubectl get pods -n observability
kubectl logs -n observability deployment/otel-collector
Send requests through Traefik, then confirm that traefik-metrics receives new records in Parseable. If your Kubernetes log collector is already forwarding Traefik pods, check traefik-logs as well.
Step 4: Add tracing for end-to-end request analysis
Metrics and access logs are the baseline for monitoring Traefik. Metrics show that a service is failing. Access logs identify the request that reached it. Traces pick up from there and follow the request through instrumented downstream services.
Add this block to traefik-values.yaml and point the endpoint at the Collector Service:
tracing:
  serviceName: traefik
  sampleRate: 0.1
  otlp:
    enabled: true
    http:
      enabled: true
      endpoint: http://otel-collector.observability.svc.cluster.local:4318/v1/traces
Apply the updated values:
helm upgrade --install traefik traefik/traefik \
  --namespace traefik \
  --create-namespace \
  --values traefik-values.yaml
For a production cluster, sampleRate: 0.1 is a reasonable place to start. Traefik uses a parent-based trace-id ratio sampler, so incoming sampling decisions are respected and new root traces are sampled by ratio. Once traces start arriving in Parseable, adjust the rate around your traffic volume and storage budget.
Send another request through Traefik and open traefik-traces. Check the new spans for service.name=traefik. If metrics arrive but traces do not, check port 4318, the /v1/traces endpoint and the exporter for traefik-traces.
Decide what to monitor in Traefik
Traefik exposes enough data to produce a long list of charts. A smaller set of signals answers most incident questions. Start with traffic, errors, latency, backend health and the collection pipeline.
| Area | Signals | Operational question |
|---|---|---|
| Traffic | Request rate by entry point, router, service and status code | Did load change and where did it go? |
| Errors | 4xx and 5xx ratio, retry attempts and origin status | Did Traefik reject the request, or did a backend fail? |
| Latency | p50, p95 and p99 duration by entry point and service | Did time accumulate at the edge or in the backend? |
| Backend health | Service request rate, open connections and unavailable endpoints | Can Traefik reach enough healthy application instances? |
| TLS | Certificate expiry and TLS errors | Will clients fail before Traefik routes a request? |
| Runtime | Restarts, memory, CPU and configuration reload failures | Can Traefik keep serving and accept configuration changes? |
| Collection | Scrape failures, refused data and exporter failures | Can you trust the monitoring data during an incident? |
Metrics show the shape of the problem across time. Access logs give you the request path, router, service, response code and retry count behind that shape. If the failure continues inside the application, traces carry the investigation beyond Traefik.
Verify the monitoring pipeline
The first validation is simple. Send traffic through two routes and include one request that returns a known 4xx response. Then check the following:
traefik_entrypoint_requests_totalincreases intraefik-metrics.traefik_service_requests_totalcontains labels for expected services.traefik-logscontains the request method, path, status, router and service.- Collector logs contain no scrape or export errors.
- If you enabled tracing,
traefik-tracescontains spans withservice.name=traefik.
You should see the same test traffic in each enabled dataset. If one signal is missing, check pod discovery, Collector permissions and the dataset headers before moving on. It is easier to fix that path now than during a 5xx spike.
Investigate a Traefik 5xx spike
Return to the checkout API from the beginning. Customers report failures, but Kubernetes readiness checks still pass. Start with metrics to find the affected service and time window, then use access logs to identify the requests behind the spike.
1. Confirm the edge failure
Start with the 5xx rate. This PromQL query calculates failed requests at each entry point:
sum by (entrypoint) (
  rate(traefik_entrypoint_requests_total{code=~"5.."}[5m])
)
Compare it with total request rate:
sum by (entrypoint) (
  rate(traefik_entrypoint_requests_total[5m])
)
If request volume stays flat while the 5xx rate rises, the cluster is not dealing with a sudden traffic surge. The next place to look is the router or backend service handling those requests.
2. Find the affected service
Group errors by Traefik service:
sum by (service) (
  rate(traefik_service_requests_total{code=~"5.."}[5m])
)
This gives you the first useful split. One service may account for most of the failures, while healthy services stay near zero.
Check service latency next:
histogram_quantile(
  0.95,
  sum by (le, service) (
    rate(traefik_service_request_duration_seconds_bucket[5m])
  )
)
The timing matters here. If 5xx responses rise before latency, check connection failures and pod availability. If p95 latency rises first, move into the backend and inspect downstream calls or resource pressure.
3. Inspect matching access logs
Filter access logs to the same five-minute window and status codes from 500 through 599, then group them by router and service.
Each matching record identifies the request path, method, Traefik pod and timestamp. You can now see whether one route, service, or replica accounts for most of the failures.
Check these fields together:
| Field | Question it answers |
|---|---|
| Router | Which Kubernetes route matched? |
| Service | Which backend received the request? |
| Request path | Which operation failed? |
| Origin status | Did the backend return the error? |
| Duration and origin duration | Did time accumulate in Traefik or the backend? |
| Retry attempts | Did Traefik retry another backend? |
At this point you have a service, route, replica and time window instead of a general report that checkout is failing. Use those values to filter the backend application logs and traces.
Alerts worth creating
Create alerts for symptoms that affect requests:
- 5xx ratio: error ratio stays above your service threshold for five minutes
- p99 service latency: latency exceeds the service objective across two evaluation windows
- Missing telemetry: the Collector stops receiving Traefik metrics
- Collector export failures: Parseable exports fail or queue pressure rises
An alert for each status code or pod restart creates noise without explaining user impact. Send request symptoms to the service owner and keep Collector failures with the platform team.
Visualize Traefik monitoring with a dashboard
Queries and alerts do the detection work. A dashboard gives everyone responding to the incident the same view of those signals.
Parseable maintains a Traefik monitoring dashboard that combines PromQL metrics with SQL access-log panels. Download traefik-monitoring-mixed.json, import it into Parseable and map its variables:
| Dashboard variable | Dataset |
|---|---|
| Metrics Dataset | traefik-metrics |
| Logs Dataset | traefik-logs |
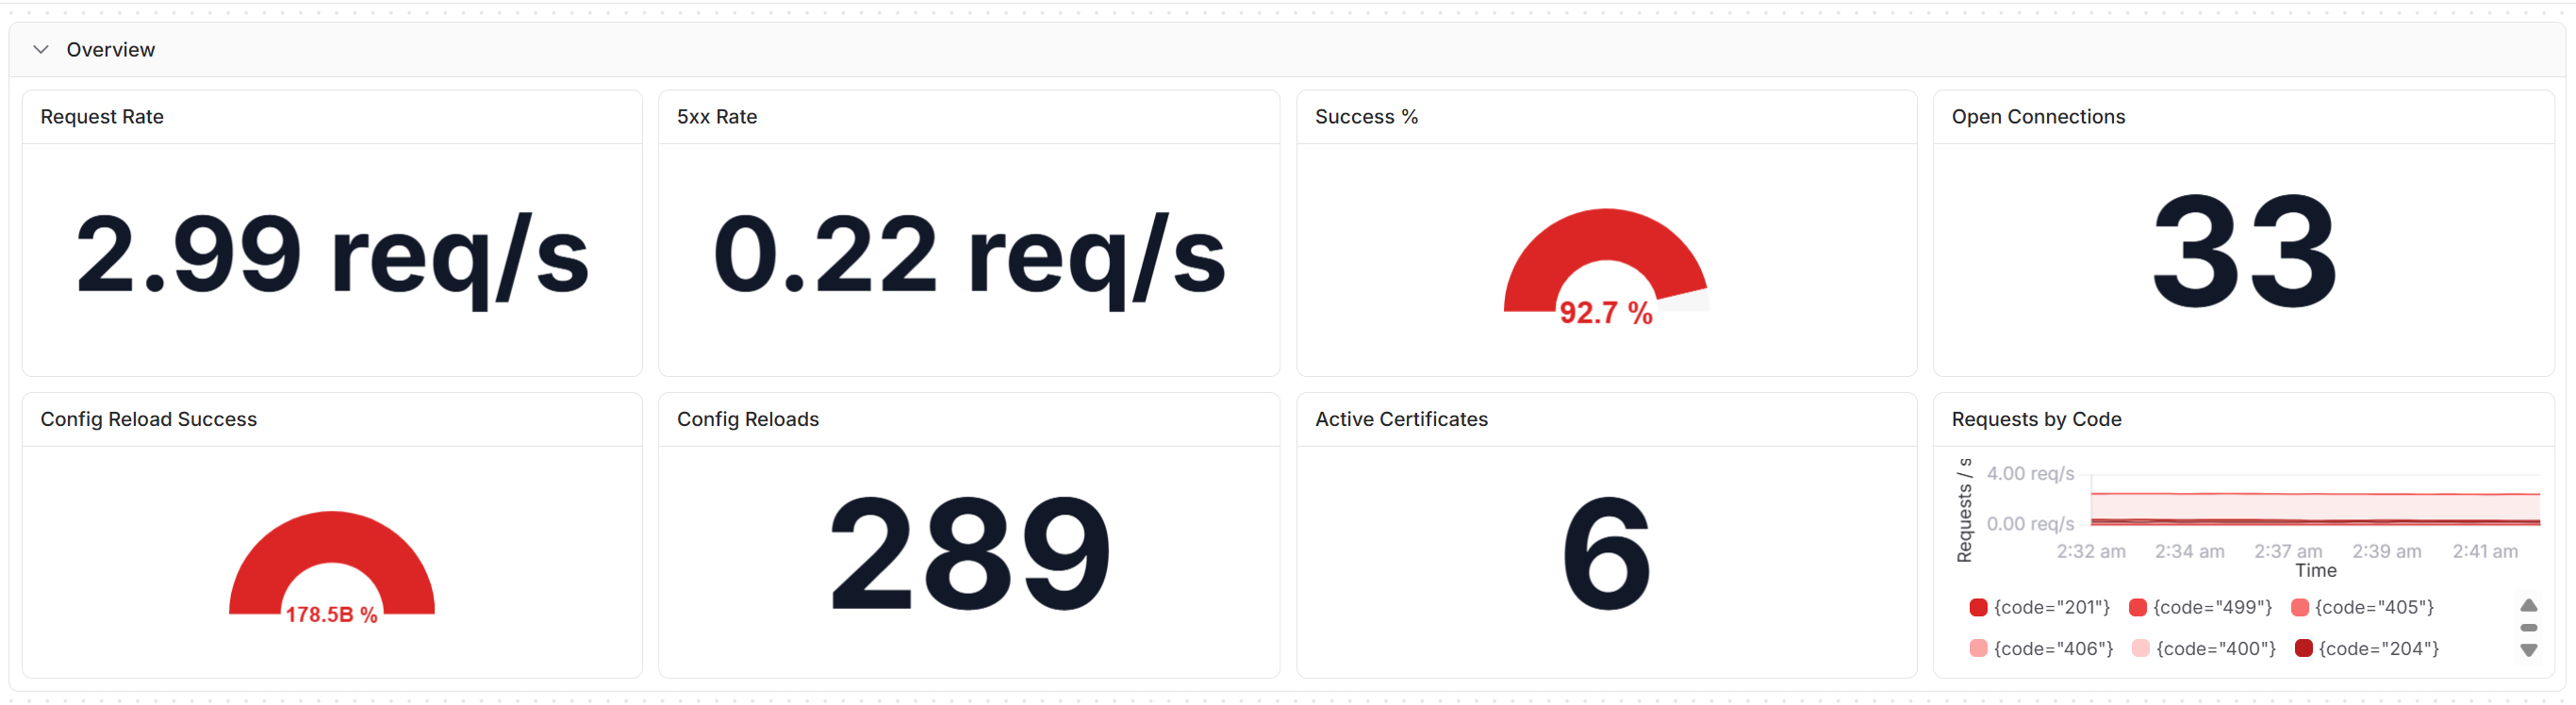
The dashboard gives the team a shared starting point. It puts request rate, errors, service latency, TLS activity, runtime health and access logs on one page. From there, use the queries above to narrow the incident instead of treating the dashboard as the whole investigation.
Production checks
- Keep
Authorization,Cookieand arbitrary query parameters out of access logs. - Keep ports
9100and4318private to the cluster. - Use Kubernetes Secrets for the Parseable API key.
- Run the Collector with batching, retries and a memory limiter.
- Keep logs, metrics and traces in separate datasets.
- Use
DEBUGlogging for a bounded investigation, then return Traefik toINFO.
Follow the request into the backend
Metrics and access logs narrow the incident to a service, route and time window. Use the trace pipeline when you need to inspect what happened after the backend accepted the request. Filter traefik-traces to the same window, open a matching trace and follow its context into instrumented downstream services.
The Traefik integration documentation also covers production settings and the optional Parseable Auto Instrumentation path.
Observe Traefik from the edge to the backend
Traefik metrics show when traffic, errors or latency change. Access logs connect that change to a request, route and Kubernetes service. Traces continue the same investigation through instrumented downstream services.
That is the useful shape of Traefik observability. Start broad with metrics, move to the failed requests in access logs and use traces when the problem continues inside the application. Parseable keeps those three views close enough that the investigation does not restart at each layer.
Send a test request through the ingress and confirm that it appears in each enabled dataset. Once that path works, import the Traefik dashboard for a reusable incident view. You can use Parseable Cloud if you need a destination for the telemetry.