
Baseten
Send Baseten logs, traces, and deployment metrics to Parseable with OpenTelemetry Collector
Baseten is an inference platform for deploying and serving machine learning models, including LLMs, behind production APIs. Teams commonly use Baseten Dedicated Inference with Truss to package a model, deploy it on managed GPU infrastructure, and expose an inference endpoint.
Parseable can store the telemetry that Baseten emits around those deployments. This guide shows how to send Baseten logs, built-in Truss traces, and deployment metrics to Parseable with an OpenTelemetry Collector.
How it works
Baseten exports each signal differently:
- Logs: Baseten sends organization-level logs to an OTLP/HTTP logs endpoint.
- Traces: A Truss deployment can export built-in request spans to an OTLP/HTTP traces endpoint after you enable tracing in
config.yaml. - Metrics: Baseten exposes deployment metrics in Prometheus format at
https://app.baseten.co/metrics; the Collector scrapes that endpoint and forwards the metrics to Parseable.
Use the Collector as the bridge between Baseten and Parseable. It keeps Parseable credentials out of the Truss config, receives OTLP from Baseten, scrapes Baseten metrics, and writes each signal into a separate Parseable dataset.

Baseten trace export should point at a Collector instead of directly at Parseable when authentication is required. Baseten's trace configuration uses environment_variables, and Baseten recommends not putting authentication credentials there.
Prerequisites
Before you start, keep these ready:
- A Baseten account and a Truss model deployed with Dedicated Inference
- The Baseten CLI authenticated locally
- An API key for invoking your model, and a Baseten workspace metrics export key
- A Parseable instance reachable from the Collector, and an API key with ingest access
- An OpenTelemetry Collector endpoint reachable from Baseten over HTTPS
- Docker, if you want to run the Collector with the example below
Set up Baseten with Parseable
Create a Baseten metrics export key
Baseten deployment metrics are scraped separately from logs and traces. Create a metrics-only workspace key for the Collector:
baseten auth login

baseten org api-key create \
  --type workspace-export-metrics \
  --name metrics-export
To restrict the key to specific models, add one or more --model-id flags:
baseten org api-key create \
  --type workspace-export-metrics \
  --name metrics-export \
  --model-id <baseten-model-id>
Store the printed key securely. Baseten shows it once, and this key is only for exporting metrics.
Configure the OpenTelemetry Collector
Create otel-collector-config.yaml:
This example exports OTLP JSON from the Collector to Parseable. X-P-Stream selects the Parseable dataset, and X-API-Key carries a Parseable API key with ingest access.
OTLP Protobuf ingestion is available in Parseable Cloud and Enterprise. If your Parseable deployment supports Protobuf, you can switch the Parseable exporters below to encoding: proto and Content-Type: application/x-protobuf.
extensions:
  health_check:
    endpoint: 0.0.0.0:13133

receivers:
  otlp:
    protocols:
      http:
        endpoint: 0.0.0.0:4318

  prometheus/baseten:
    config:
      scrape_configs:
        - job_name: baseten
          scheme: https
          metrics_path: /metrics
          scrape_interval: 60s
          static_configs:
            - targets: [app.baseten.co]
          authorization:
            type: Bearer
            credentials: ${env:BASETEN_METRICS_EXPORT_KEY}

processors:
  memory_limiter:
    check_interval: 1s
    limit_mib: 384
    spike_limit_mib: 96
  batch:
    timeout: 5s
    send_batch_size: 512

exporters:
  otlphttp/parseable_logs:
    endpoint: ${env:PARSEABLE_ENDPOINT}
    encoding: json
    headers:
      X-API-Key: ${env:PARSEABLE_API_KEY}
      X-P-Stream: ${env:PARSEABLE_LOGS_STREAM}
      Content-Type: application/json

  otlphttp/parseable_traces:
    endpoint: ${env:PARSEABLE_ENDPOINT}
    encoding: json
    headers:
      X-API-Key: ${env:PARSEABLE_API_KEY}
      X-P-Stream: ${env:PARSEABLE_TRACES_STREAM}
      Content-Type: application/json

  otlphttp/parseable_metrics:
    endpoint: ${env:PARSEABLE_ENDPOINT}
    encoding: json
    headers:
      X-API-Key: ${env:PARSEABLE_API_KEY}
      X-P-Stream: ${env:PARSEABLE_METRICS_STREAM}
      Content-Type: application/json

service:
  extensions: [health_check]
  pipelines:
    logs:
      receivers: [otlp]
      processors: [memory_limiter, batch]
      exporters: [otlphttp/parseable_logs]
    traces:
      receivers: [otlp]
      processors: [memory_limiter, batch]
      exporters: [otlphttp/parseable_traces]
    metrics:
      receivers: [prometheus/baseten]
      processors: [memory_limiter, batch]
      exporters: [otlphttp/parseable_metrics]
Configure the Collector environment:
export PARSEABLE_ENDPOINT="https://parseable.example.com"
export PARSEABLE_API_KEY="<parseable-api-key>"
export PARSEABLE_LOGS_STREAM="baseten-logs"
export PARSEABLE_TRACES_STREAM="baseten-traces"
export PARSEABLE_METRICS_STREAM="baseten-metrics"
export BASETEN_METRICS_EXPORT_KEY="<baseten-workspace-export-metrics-key>"
Run the Collector:
docker run --rm \
  -p 0.0.0.0:4318:4318 \
  -p 127.0.0.1:13133:13133 \
  -e PARSEABLE_ENDPOINT \
  -e PARSEABLE_API_KEY \
  -e PARSEABLE_LOGS_STREAM \
  -e PARSEABLE_TRACES_STREAM \
  -e PARSEABLE_METRICS_STREAM \
  -e BASETEN_METRICS_EXPORT_KEY \
  -v "$PWD/otel-collector-config.yaml:/etc/otelcol-contrib/config.yaml:ro" \
  otel/opentelemetry-collector-contrib:0.130.1 \
  --config=/etc/otelcol-contrib/config.yaml
Check the Collector health endpoint:
curl http://localhost:13133The response should include "status":"Server available".
Baseten must reach the Collector over HTTPS. For production, run the Collector behind a stable TLS endpoint and protect ingress with a reverse proxy, private networking, or an allowlist. Do not expose an unauthenticated OTLP receiver broadly on the internet.
For a short local proof of concept, put a temporary HTTPS tunnel in front of the local Collector:
ngrok http 4318Use the generated HTTPS forwarding URL as the Collector base URL in the Baseten settings below.
Export Baseten logs
Baseten log export is configured at the organization level, so one OTLP destination receives logs for the organization.
In the Baseten dashboard:
- Open Organization settings > General settings.
- In the OTEL connection card, choose Add connection.
- Set Endpoint URL to the full Collector logs endpoint:
https://otel.example.com/v1/logs- Set Header name to a header accepted by your Collector or edge proxy.
- Set Header value to the credential for that header.
- Add any additional headers required by your receiver.
- Save the connection.
For the simple Collector example above, the Collector does not require an ingress credential. In a local proof of concept, you can use a harmless routing header to satisfy the Baseten form:
| Field | Value |
|---|---|
| Endpoint URL | https://<collector-host>/v1/logs |
| Header name | X-P-Stream |
| Header value | baseten-logs |
The Collector still decides the final Parseable dataset using PARSEABLE_LOGS_STREAM.
Baseten exports new log records only. Historical logs are not backfilled. Delivery is best effort: Baseten retries transient failures, but records can be dropped if retries are exhausted or the export buffer fills.
Baseten's connection test sends a probe only for supported vendor domains. Custom Collector or Parseable endpoints can still receive real logs even when the test action returns an error, so verify delivery with a real inference request.
If the OTEL connection card is not visible in your Baseten settings, contact Baseten support to enable log export for the organization.
Export Truss traces
Built-in trace export applies to Dedicated Inference deployments that use the Truss server. For custom servers, configure OpenTelemetry instrumentation in your server or framework instead.
Enabling built-in trace export can add request overhead. Turn it on deliberately and check latency before using it for production traffic.
Update the Truss config.yaml for your model:
environment_variables:
  OTEL_EXPORTER_OTLP_ENDPOINT: https://otel.example.com/v1/traces

runtime:
  enable_tracing_data: true
Use your public Collector trace endpoint and include /v1/traces.
Deploy the updated Truss:
truss pushIf this creates a new deployment that is not serving production traffic yet, promote it from the Baseten dashboard or with your normal deployment workflow. Then send inference requests to generate traces.
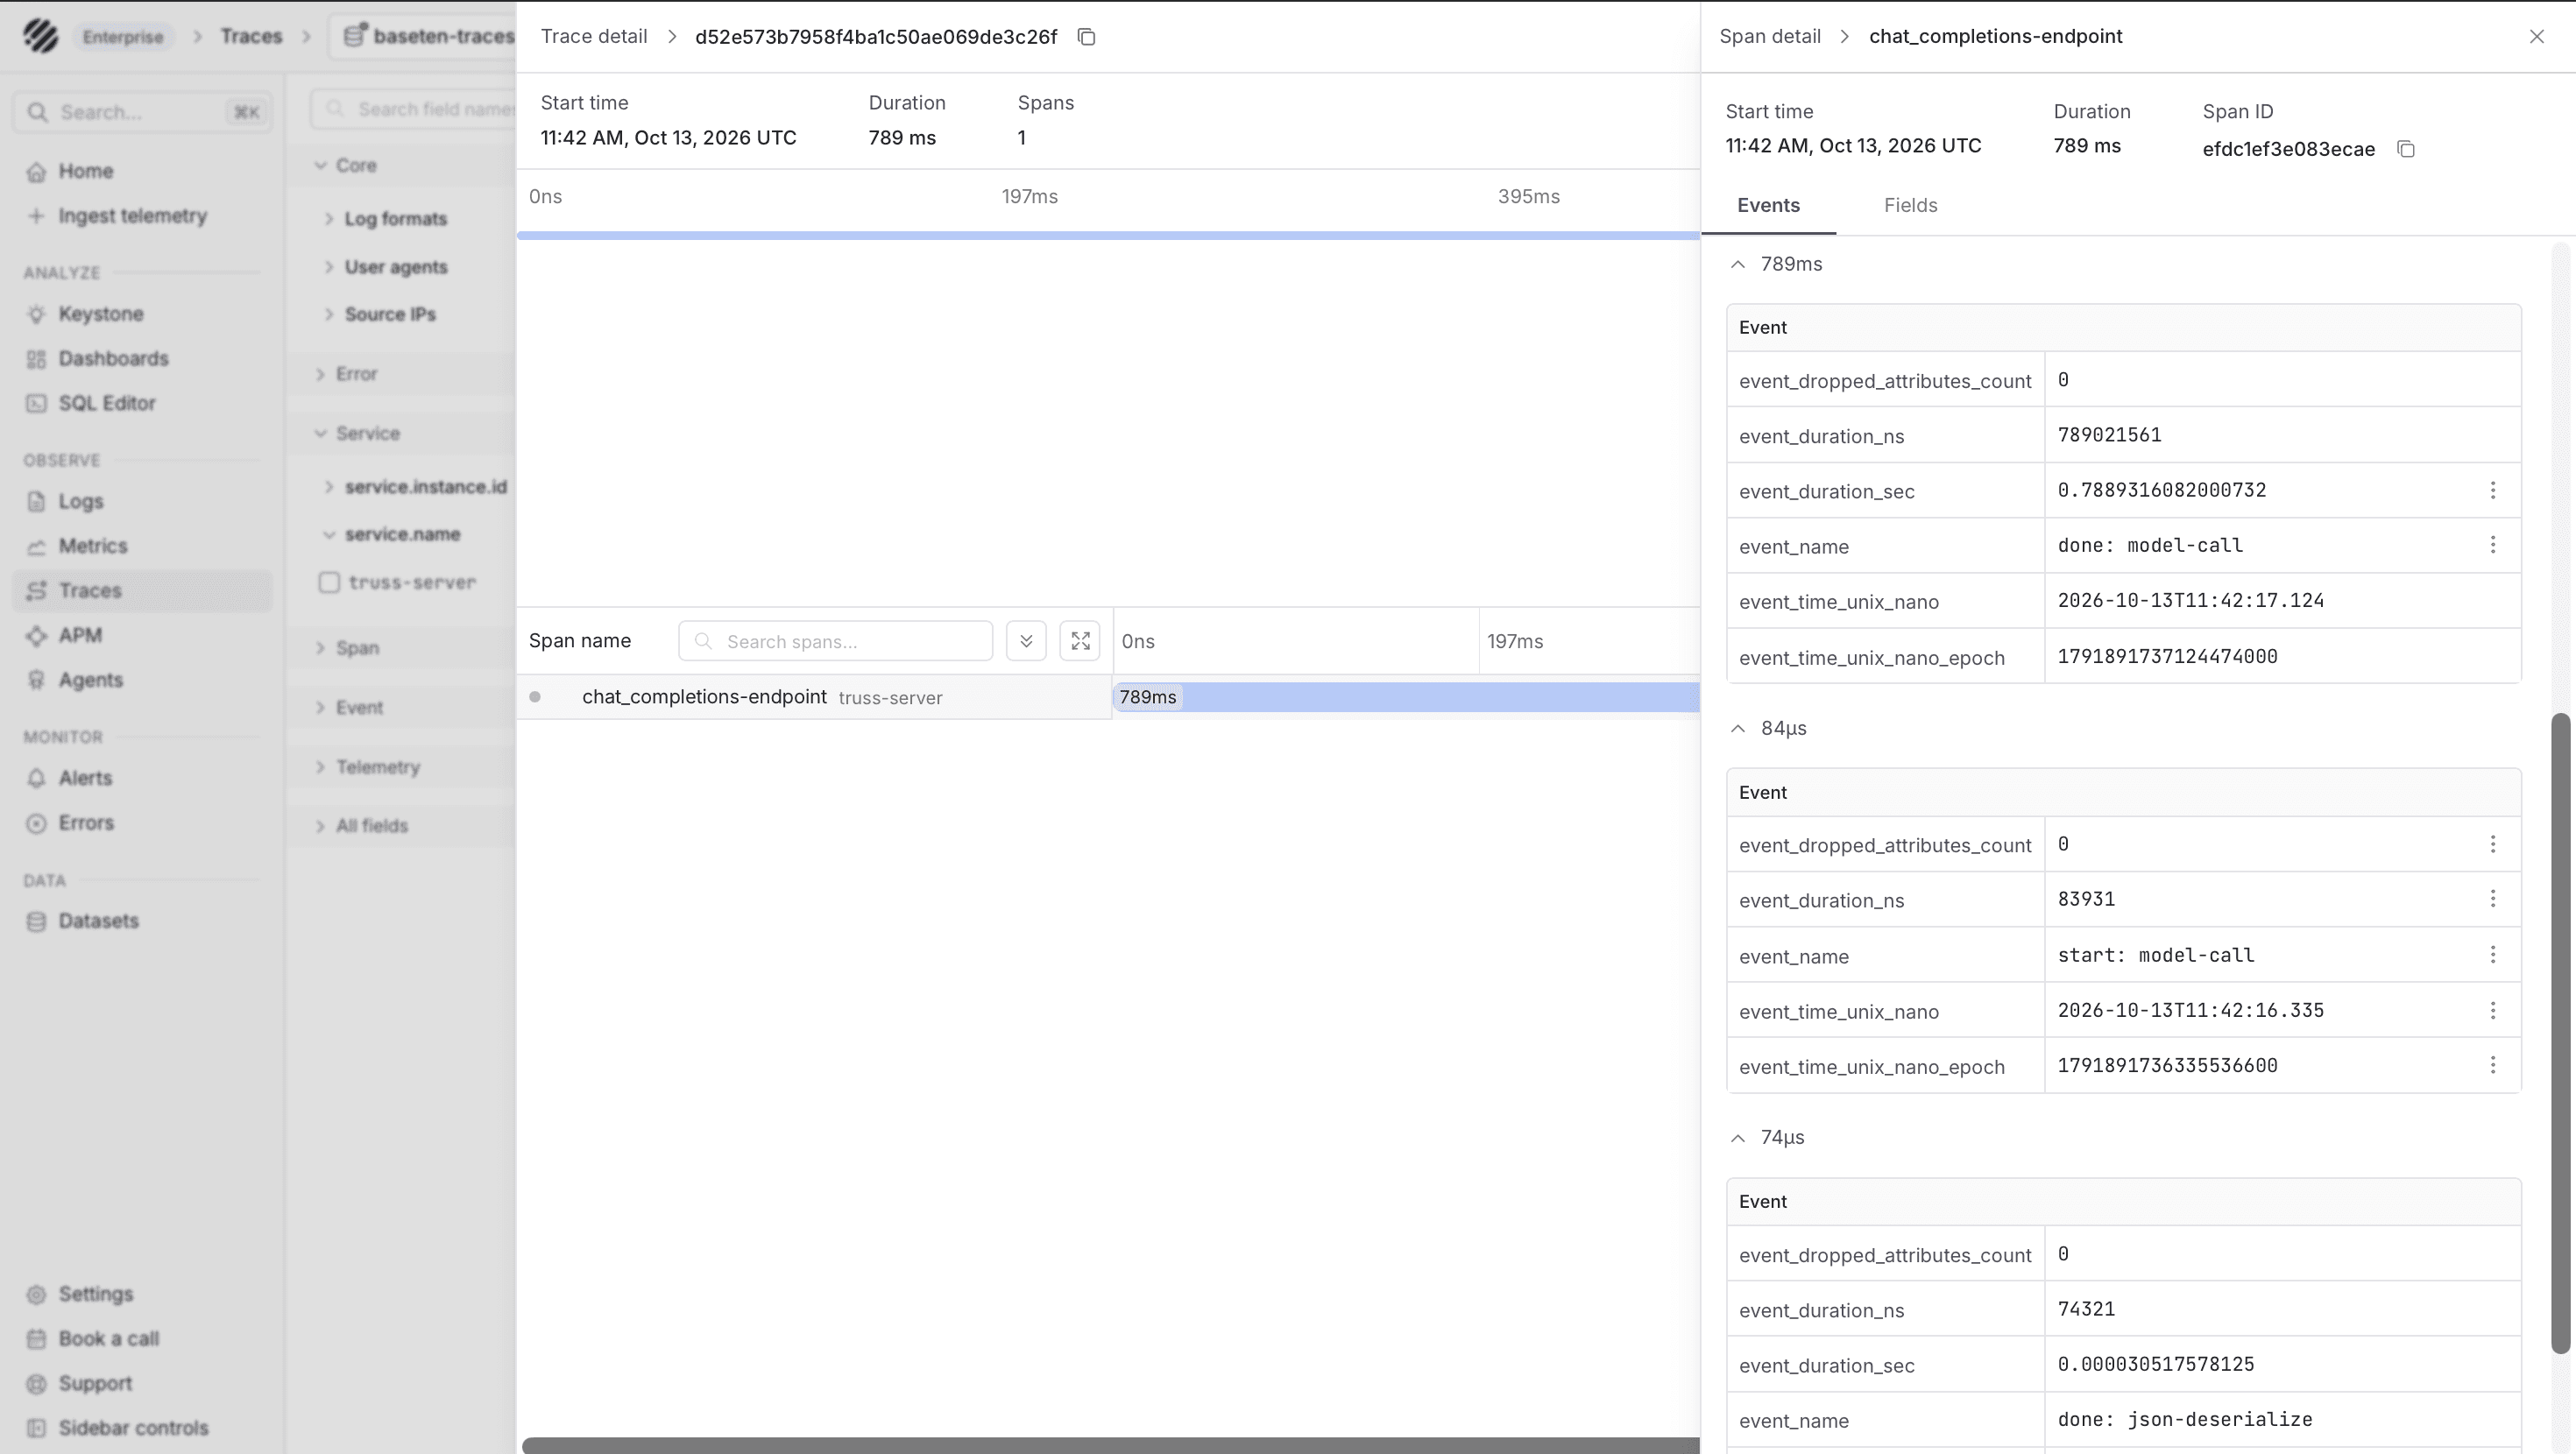
In Parseable, Truss built-in spans usually have service.name set to truss-server.
Export Baseten deployment metrics
The Collector configuration above scrapes:
https://app.baseten.co/metricswith BASETEN_METRICS_EXPORT_KEY, then forwards the data to the baseten-metrics dataset.
Keep the scrape interval at 60s. Baseten rate limits the metrics endpoint to six requests per minute per organization across all keys and collectors.
After one scrape interval, verify scrape health before building dashboards. A healthy scrape should include an up sample for the baseten job, and the baseten-metrics dataset should start receiving deployment metric samples.
Generate test telemetry
Send an inference request to the production environment:
export BASETEN_API_KEY="<baseten-api-key>"
export BASETEN_MODEL_ID="<baseten-model-id>"
export BASETEN_MODEL_NAME="<served-model-name>"

curl -sD- \
  "https://model-${BASETEN_MODEL_ID}.api.baseten.co/environments/production/sync/v1/chat/completions" \
  -H "Content-Type: application/json" \
  -H "Authorization: Bearer ${BASETEN_API_KEY}" \
  -d '{
    "model": "'"${BASETEN_MODEL_NAME}"'",
    "messages": [
      {
        "role": "user",
        "content": "Say hello from a Baseten deployment and emit normal serving telemetry."
      }
    ]
  }'
Keep the X-Baseten-Request-Id response header. It is useful for finding related Baseten logs.
Explore data in Parseable
Open Parseable and confirm that the datasets exist: baseten-metrics, baseten-logs, and baseten-traces.
Run quick checks from the Parseable query UI:
SELECT * FROM "baseten-metrics"
ORDER BY p_timestamp DESC
LIMIT 20;
SELECT * FROM "baseten-logs"
ORDER BY p_timestamp DESC
LIMIT 20;SELECT * FROM "baseten-traces"
ORDER BY p_timestamp DESC
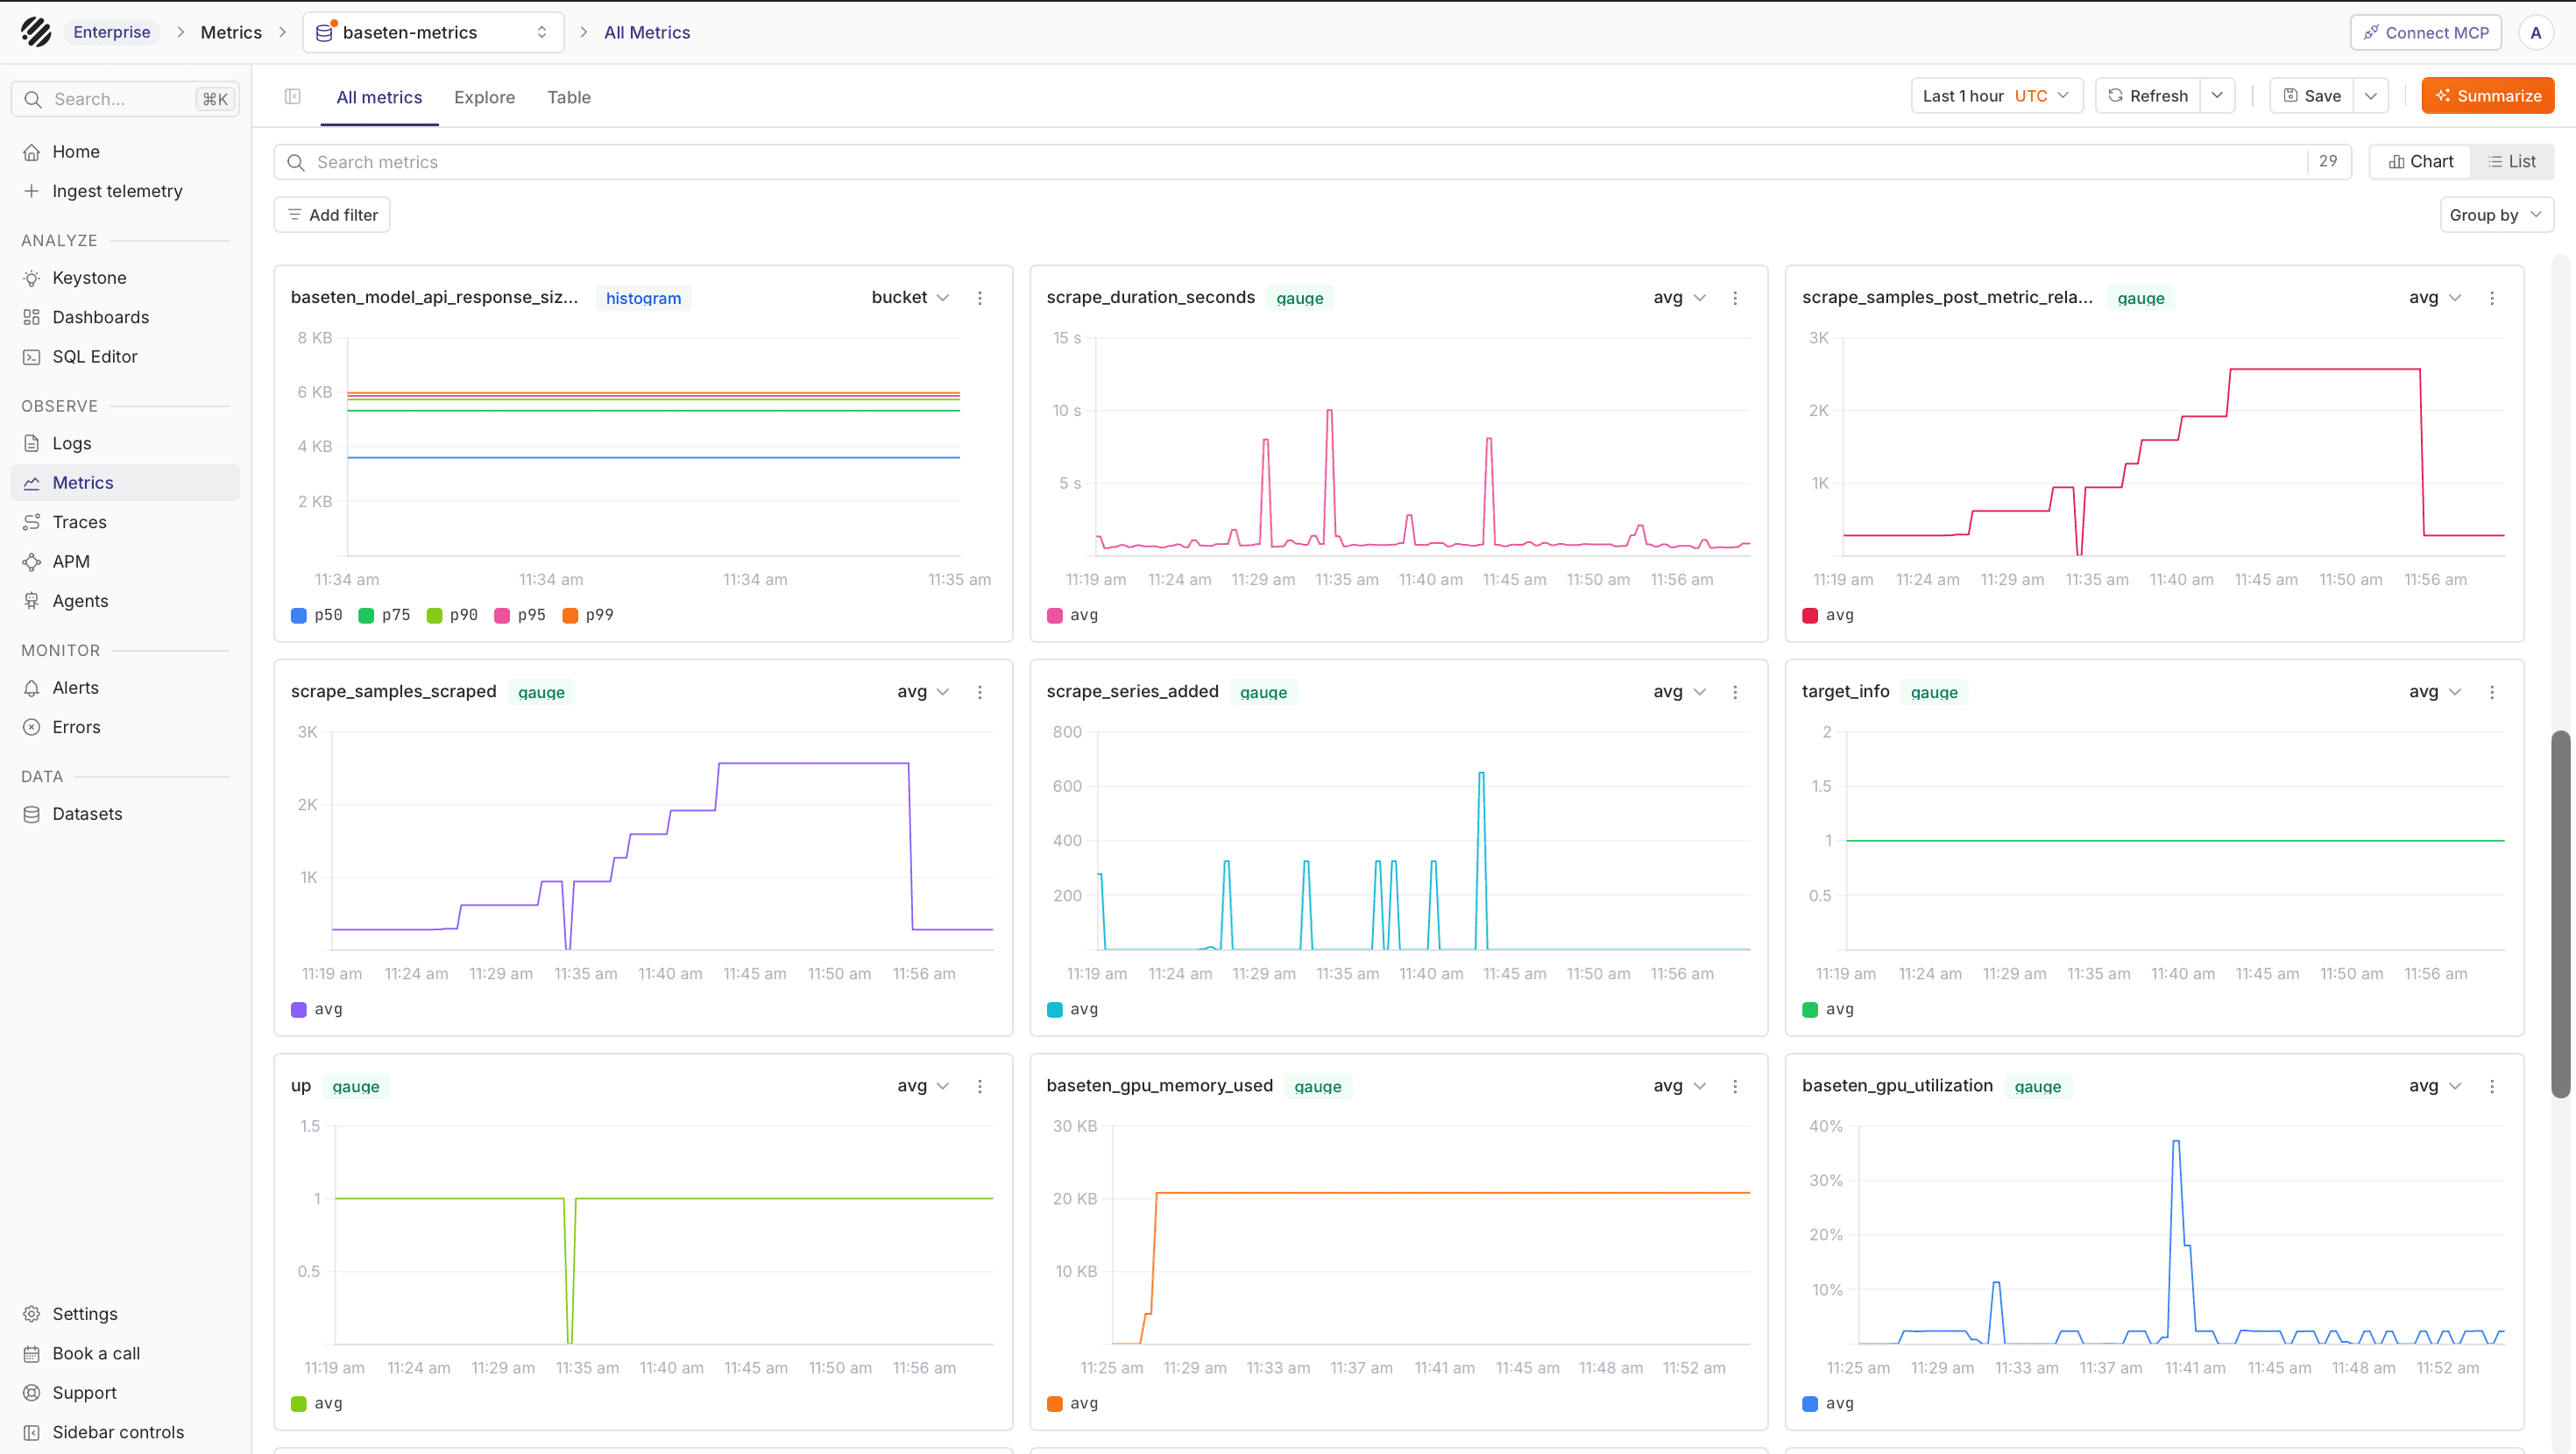
LIMIT 20;Open baseten-metrics from the Metrics page. The dataset contains the Prometheus samples scraped from Baseten and forwarded through the Collector.
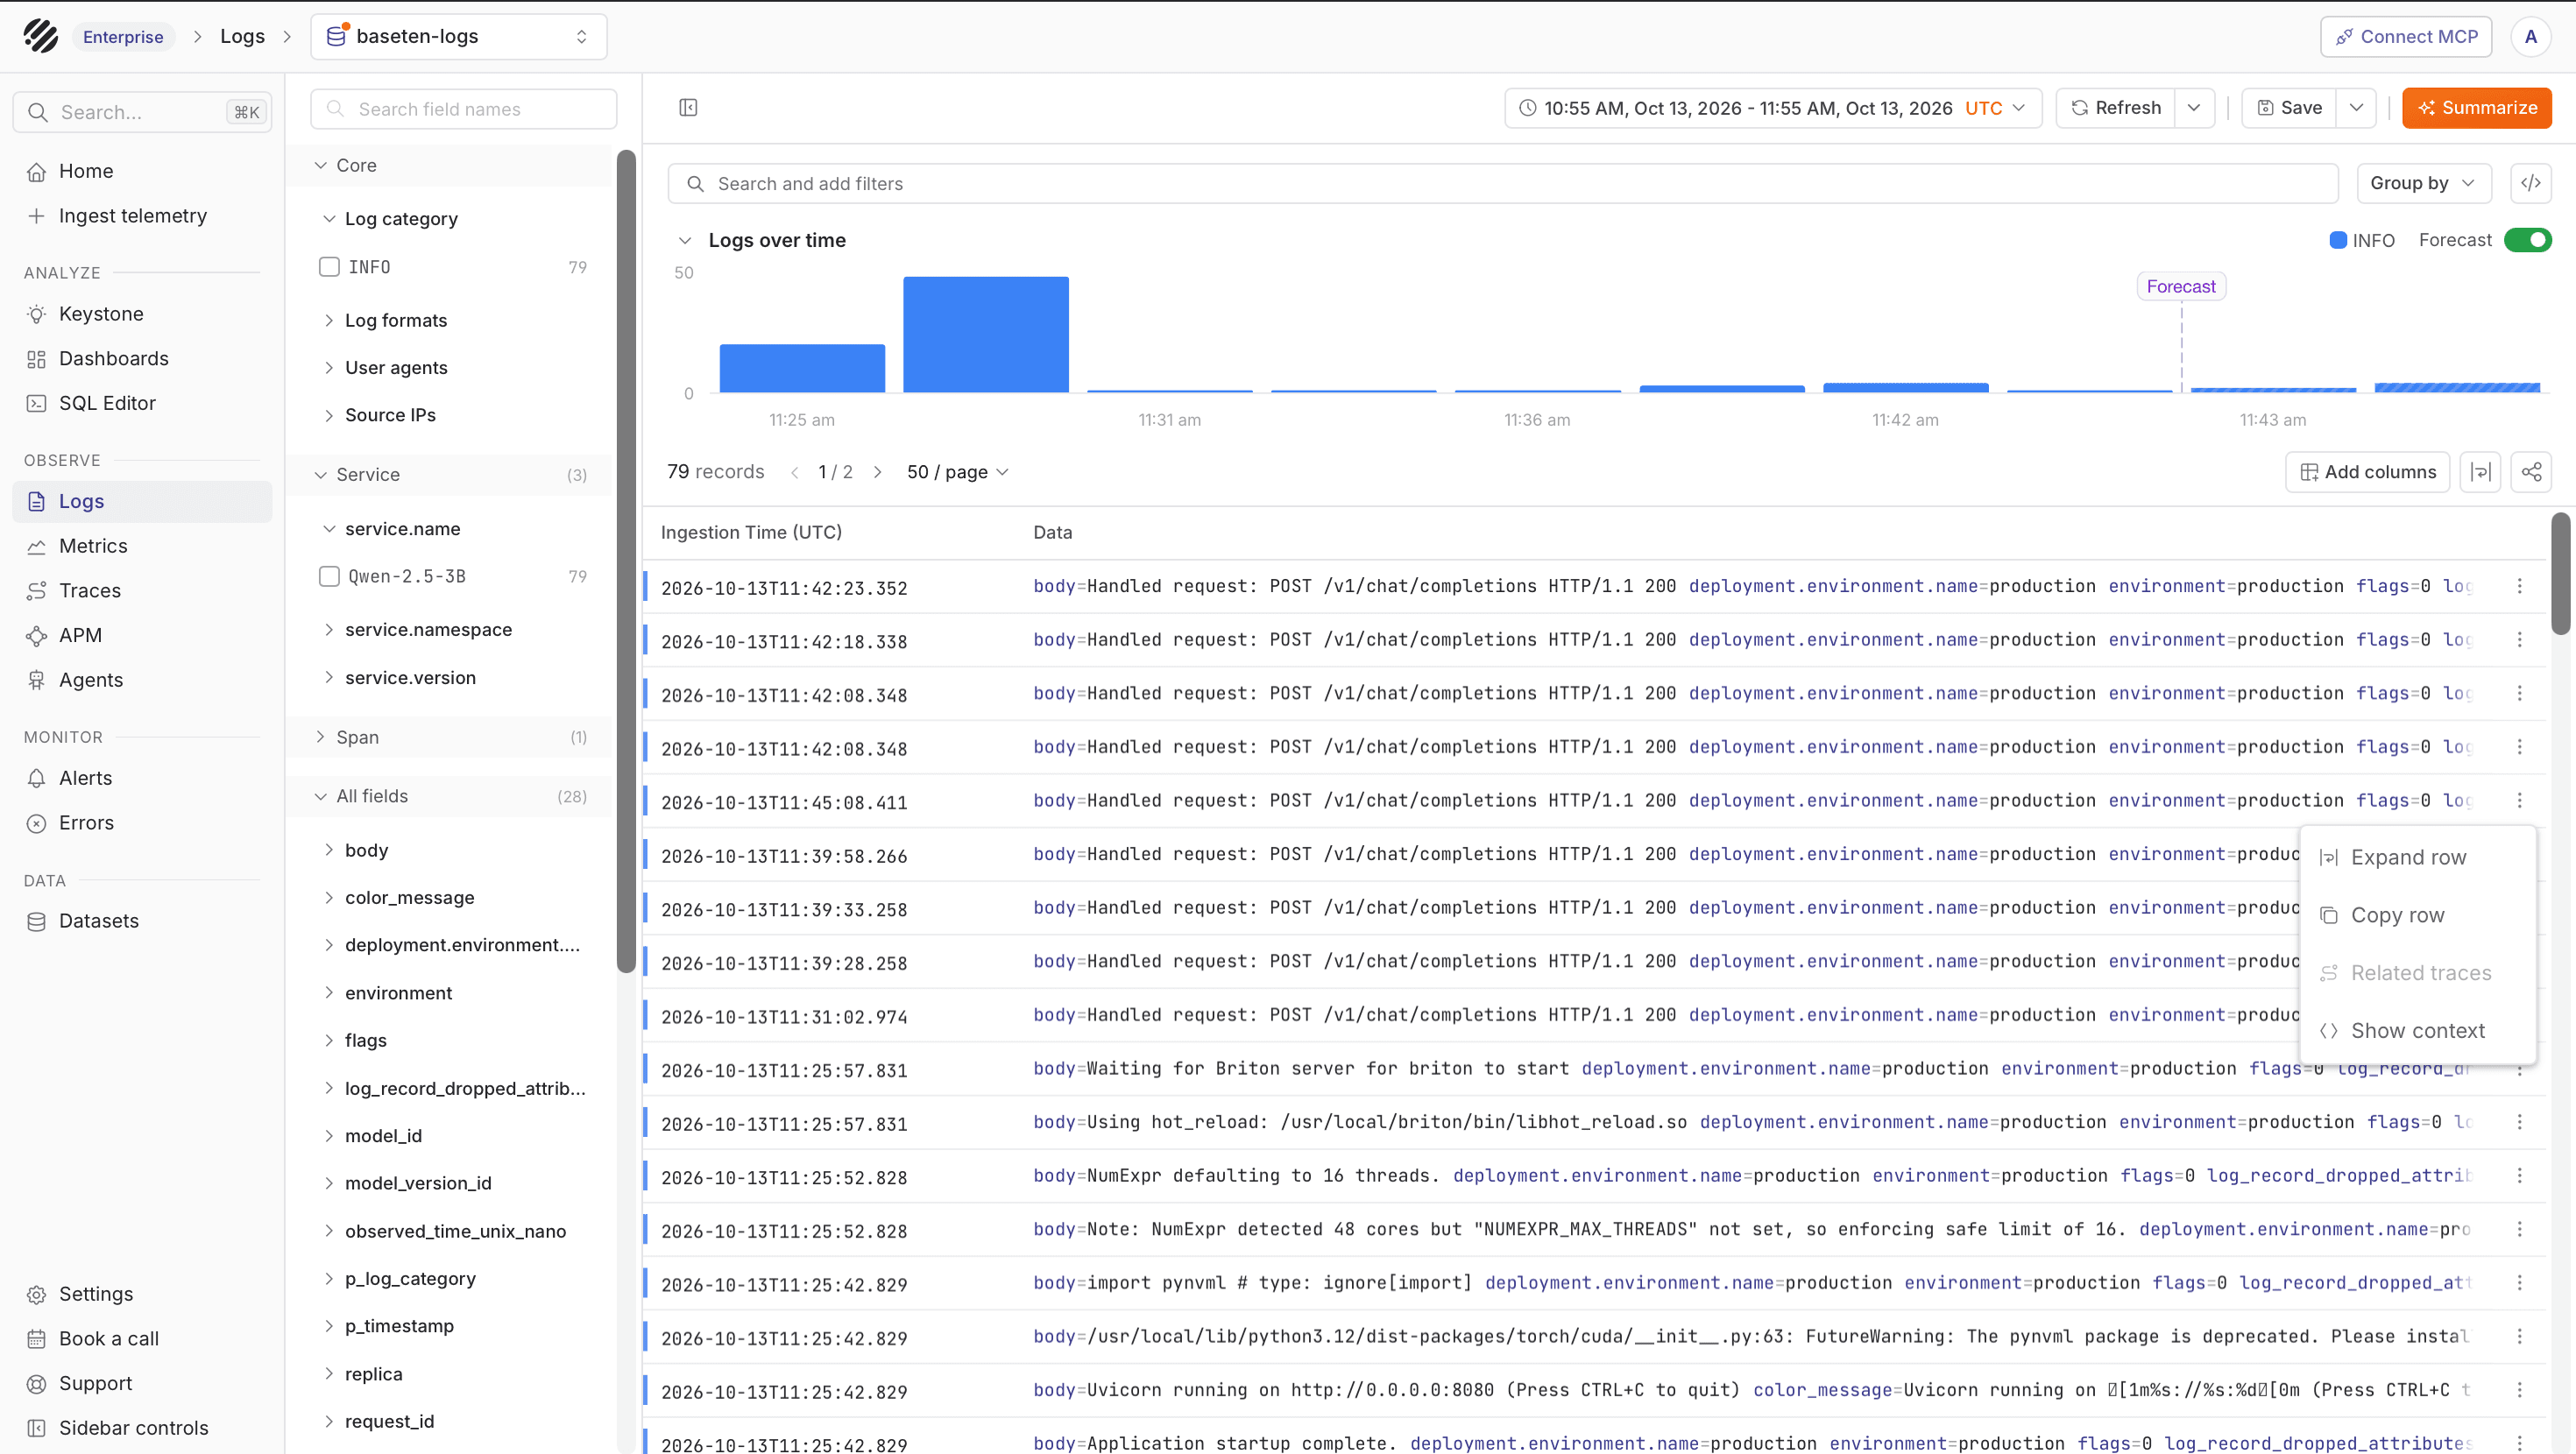
Open baseten-logs from the Logs page. The dataset shows Baseten serving logs, deployment metadata, service filters, and log volume over time.
Open baseten-traces from the Traces page. The dataset shows Truss request spans and related OpenTelemetry attributes for the deployment.
Dashboards
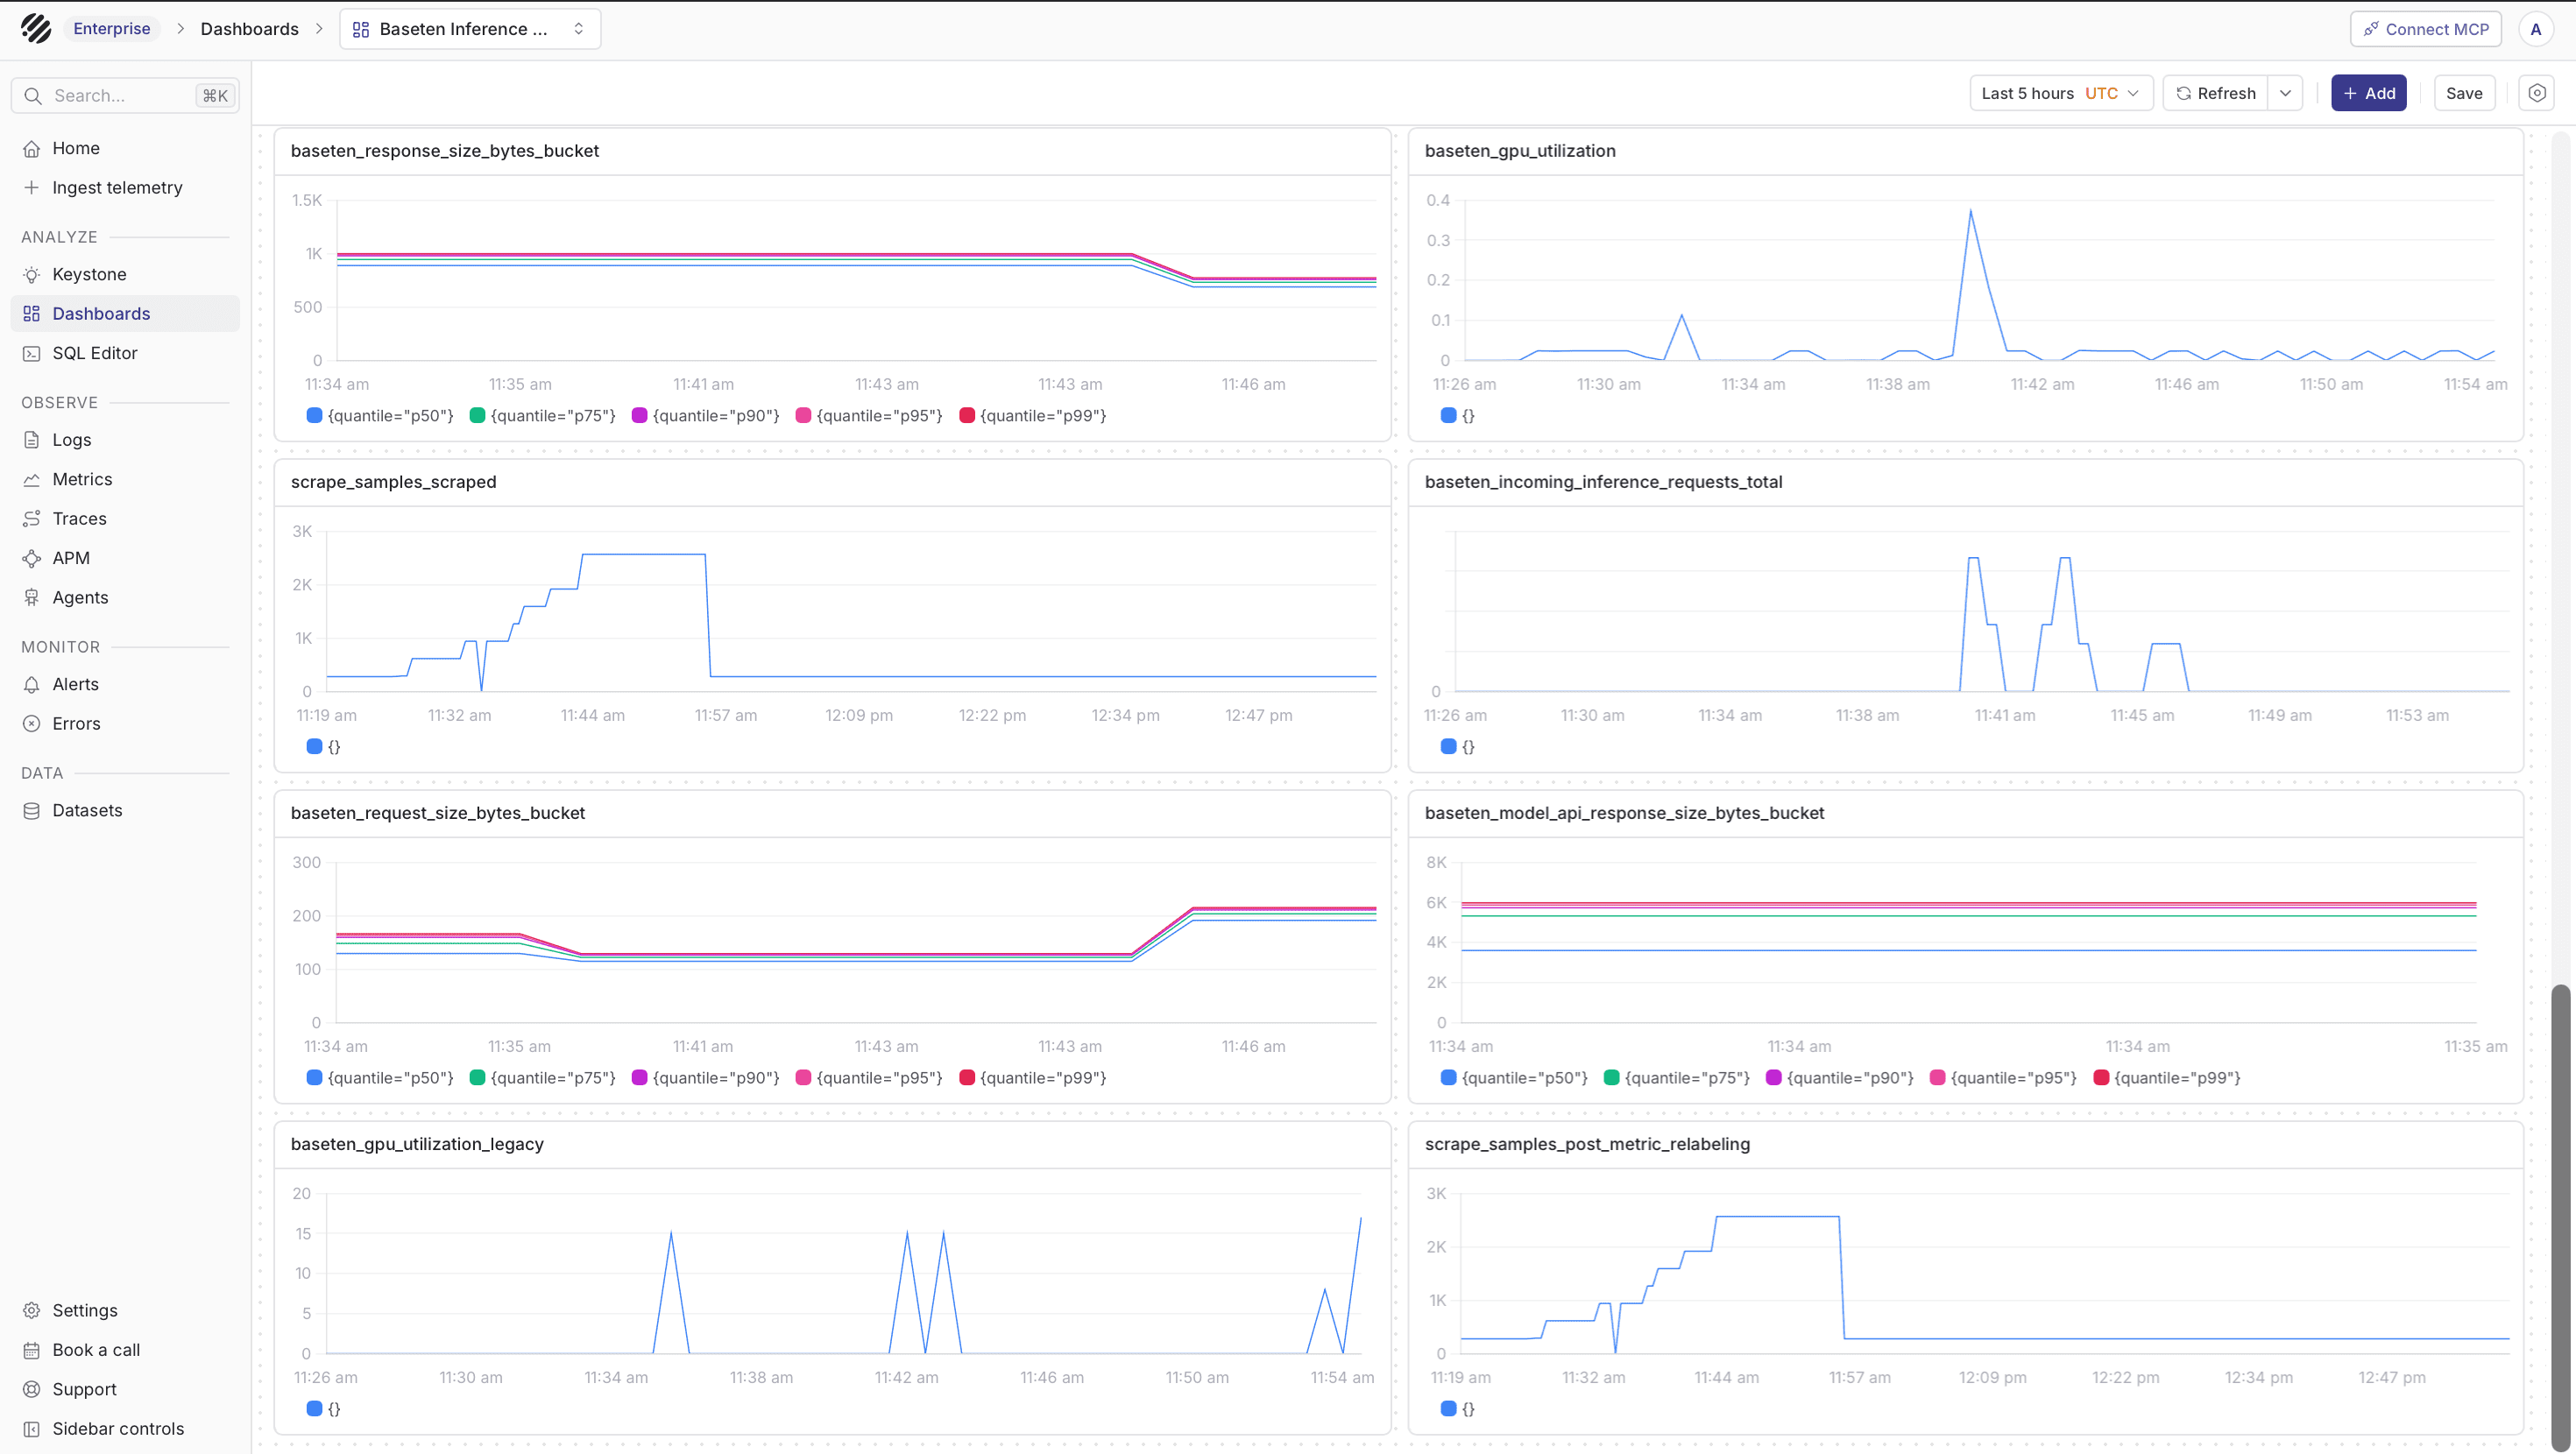
The reusable Baseten Observability dashboard is available in the parseablehq/dashboards repository.
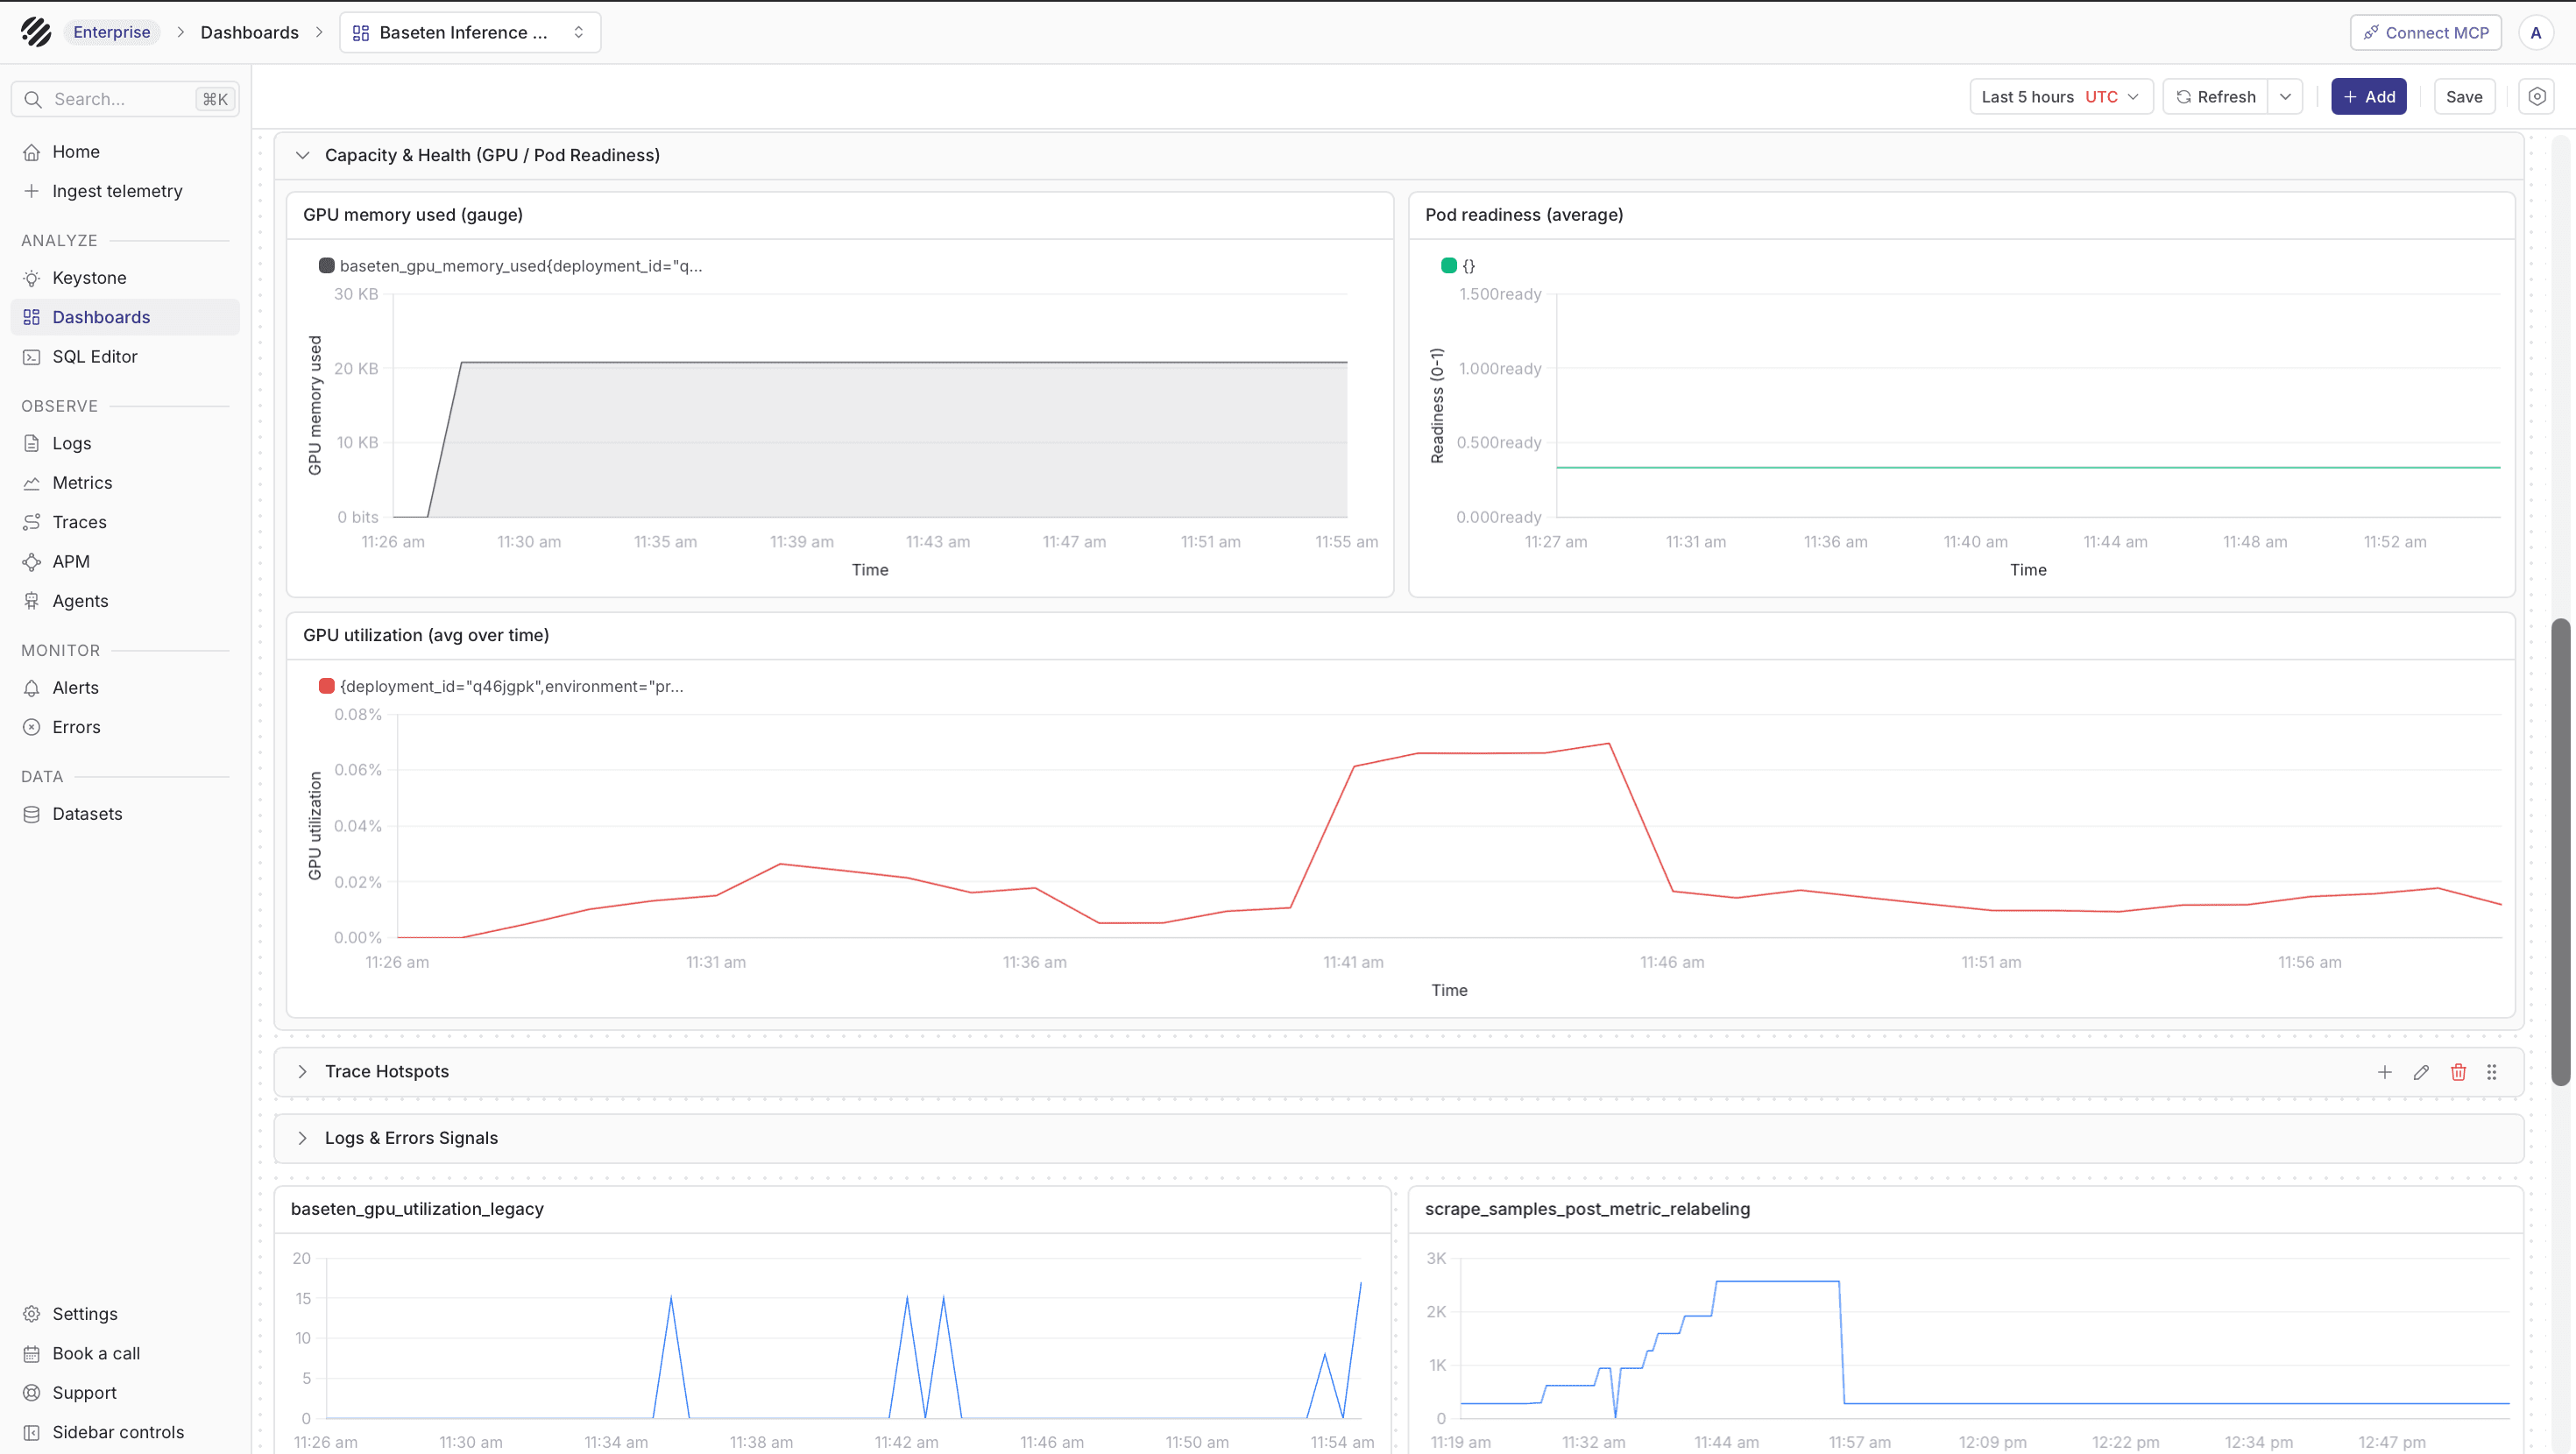
Import baseten-observability-mixed.json, then map its dataset variables to baseten-metrics, baseten-logs, and baseten-traces, or to your chosen dataset names. The dashboard combines request traffic, latency, concurrency, GPU capacity, pod readiness, logs, errors, and trace hotspots in one view.
Troubleshooting
| Symptom | What to check |
|---|---|
| No logs in Parseable | Confirm the Baseten OTEL connection uses /v1/logs, the Collector is reachable from Baseten, and new logs were generated after the connection was saved. |
| Baseten connection test fails for a custom domain | Baseten can still export logs to custom endpoints even when the dashboard test does not support that domain. Verify delivery in Parseable with a real prediction request. |
| No traces in Parseable | Confirm runtime.enable_tracing_data: true, the trace endpoint includes /v1/traces, the updated deployment is active, and the Collector is reachable over HTTPS. |
| No metrics in Parseable | Confirm BASETEN_METRICS_EXPORT_KEY is a workspace-export-metrics key and the Collector has been running for at least one scrape interval. |
401 from Parseable | Check PARSEABLE_API_KEY, the X-API-Key header, and that you are using the Parseable ingest endpoint. |
429 from Baseten metrics | Use a 60s scrape interval and reduce the number of collectors scraping the organization metrics endpoint. |
| The deployment is costing money while testing | Deactivate or scale down the Baseten deployment when you are done generating telemetry. Reactivate it before sending more test inference requests. |
References
Was this page helpful?