

The New Observability Challenge
Observability used to mean one thing: collect logs, metrics, and traces from servers, containers, and cloud services. Teams built pipelines around that assumption and it worked — until the workloads changed.
Today's engineering teams don't just run servers. They run AI agents that plan multi-step tasks, call external tools, and generate code. They run LLM gateways that route prompts across providers. They run agentic pipelines where an orchestrator spawns sub-agents, each making decisions and incurring costs autonomously.
All of these systems produce telemetry — but the signals are different. Traditional infrastructure emits logs, metrics, and traces. AI systems emit those plus token counts, model latency breakdowns, tool call audit trails, and cost data that changes with every request. A Kubernetes pod crashing is a log line. An agent burning $40 in tokens on a circular reasoning loop is a business event buried in trace attributes.
The backend must handle both in one place, with one query interface. Otherwise you're correlating across four dashboards, two query languages, and three billing systems to answer one question.
Parseable is that backend. It ingests all telemetry through native OTLP endpoints, stores everything on S3 in Apache Parquet format, and lets you query with SQL. One binary. One interface. Every signal type from every source.
Architecture: Two Telemetry Lanes, One Backend
The key insight is that modern observability has two telemetry lanes converging on the same destination:
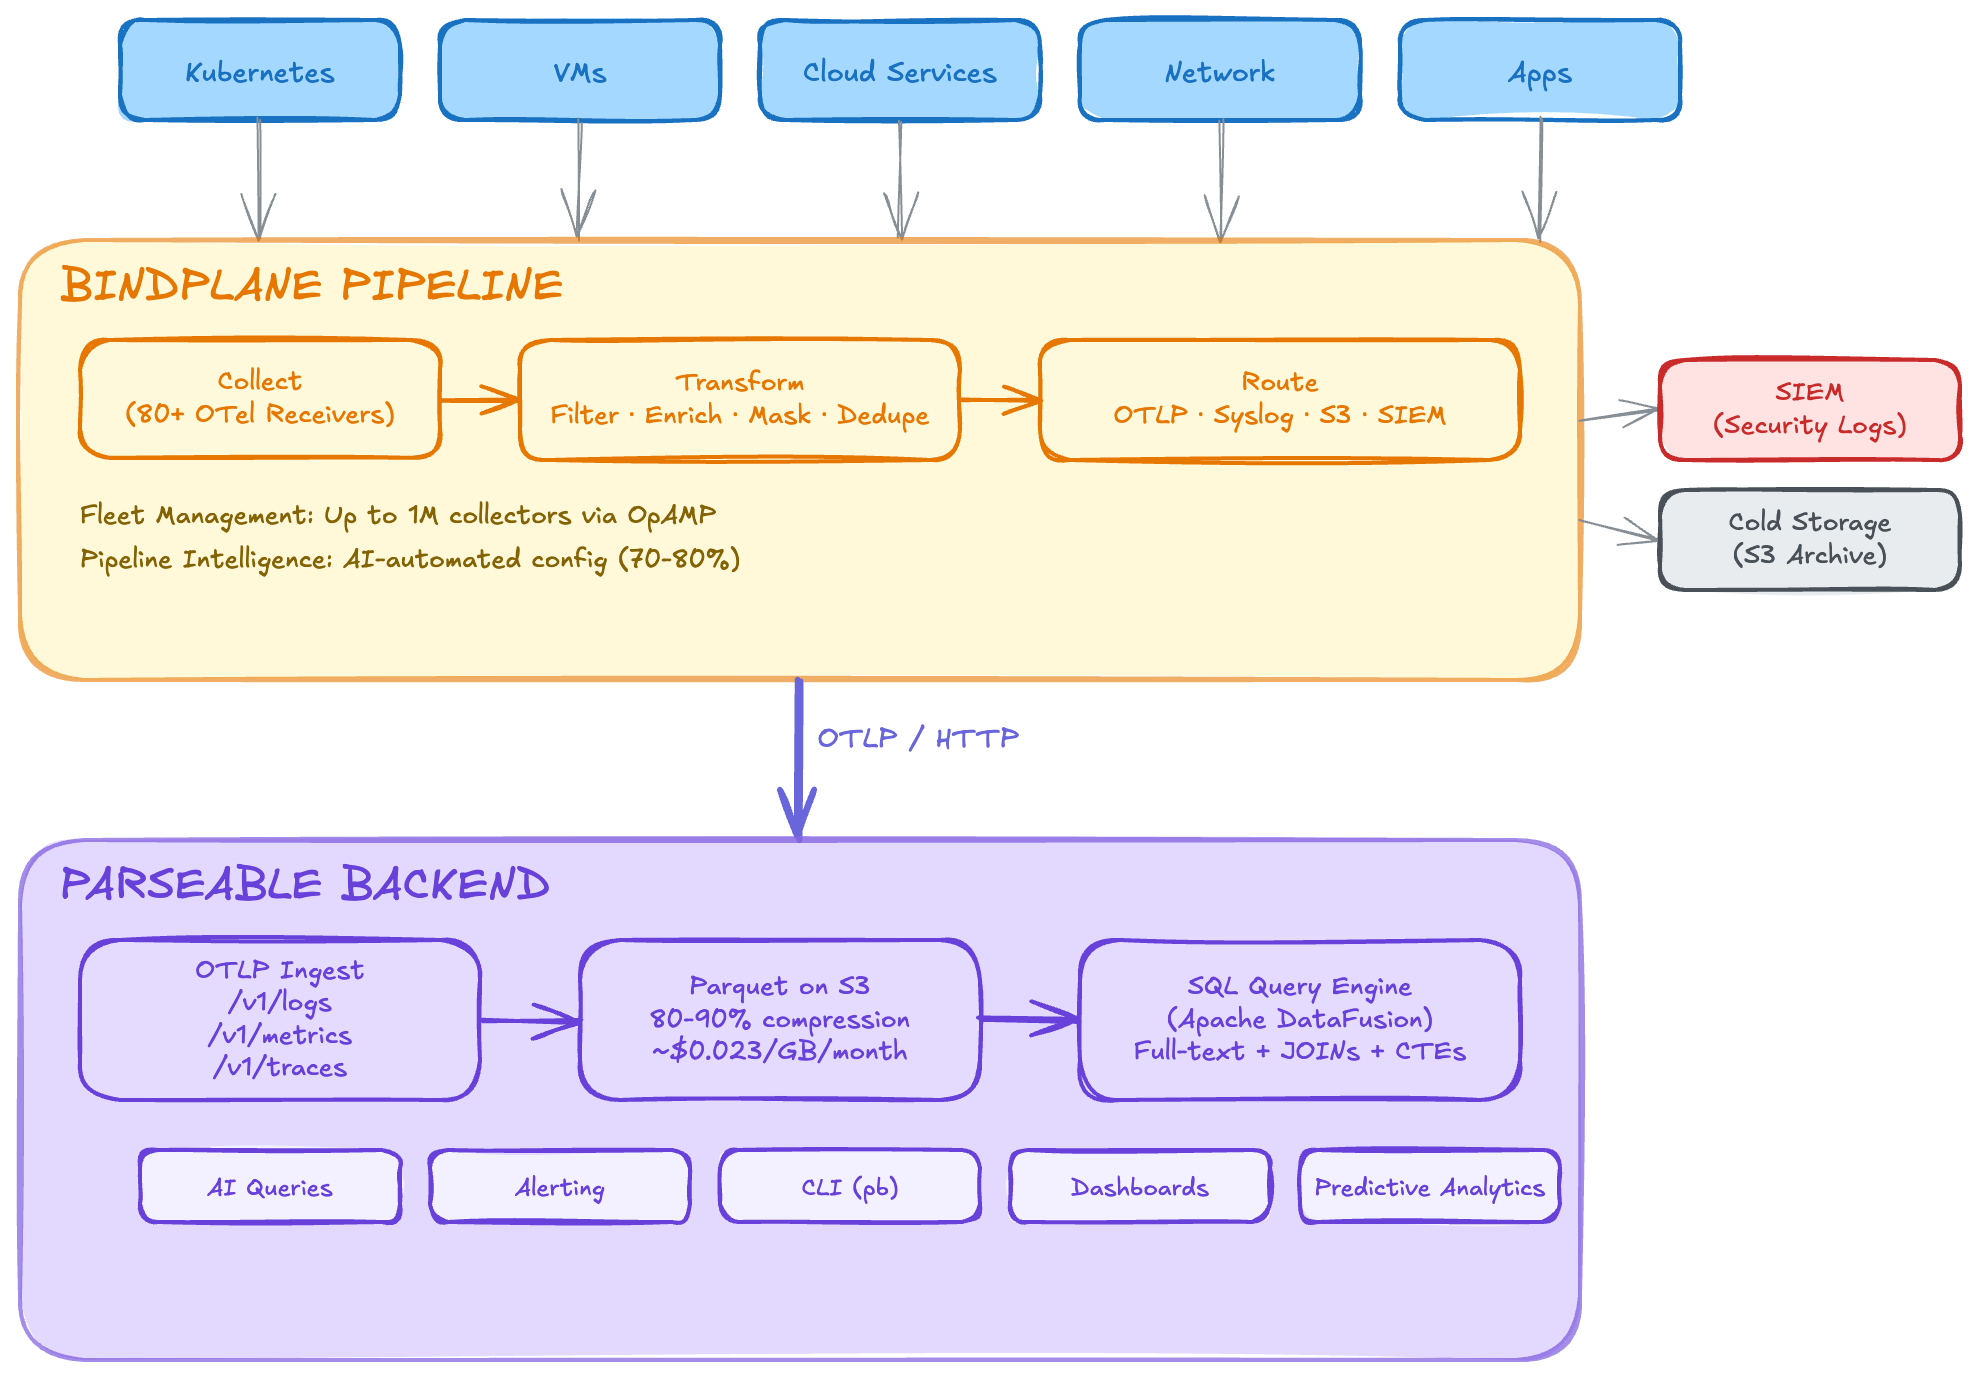
Lane 1 — Infrastructure telemetry: Servers, containers, network devices, and cloud services emit logs, metrics, and traces. Bindplane (an OpenTelemetry-native pipeline manager) collects, transforms, and routes this data through managed OTel Collector fleets. Output: OTLP to Parseable.
Lane 2 — AI system telemetry: AI agents, LLM gateways, and agentic workflows are instrumented with OpenTelemetry SDKs using the GenAI semantic conventions. An OTel Collector aggregates and exports spans that carry model names, token counts, tool call results, and cost data. Output: OTLP to Parseable.
Both lanes speak OTLP. Both land in the same Parseable instance. Both are queryable with the same SQL interface.
Lane 1: Infrastructure
  Servers / K8s / Cloud → Bindplane (OTel Collector fleet) → OTLP → Parseable

Lane 2: AI Systems
  Agents / LLMs / Gateways → OTel SDK (GenAI conventions) → OTel Collector → OTLP → Parseable

                                    ┌──────────────┐
                                    │  Parseable    │
                                    │  S3 + Parquet │
                                    │  SQL queries  │
                                    └──────────────┘
Infrastructure Observability via Bindplane
Bindplane solves the infrastructure side of the equation. It manages fleets of up to one million OTel Collectors, with visual pipeline configuration, volume reduction (up to 40% before data reaches its destination), and advanced routing to multiple backends simultaneously.
Zero-Translation OTLP Ingestion
Bindplane's OTLP destination exports metrics, logs, and traces to any OTLP-compatible endpoint. Parseable exposes fully compliant OTLP/HTTP endpoints at /v1/logs, /v1/traces, and /v1/metrics. Zero format conversion — Bindplane speaks OTLP natively, Parseable ingests OTLP natively. No adapters, no translation layers, no data loss.
Complementary Cost Optimization
Bindplane reduces telemetry volume before it reaches its destination — filtering noise, deduplicating, and compressing. Parseable then stores that optimized data at minimal cost on S3 in Parquet format with 80–90% compression ratios.
| Stage | Tool | Cost Impact |
|---|---|---|
| Collection & routing | Bindplane | Reduces volume by up to 40% through filtering, sampling, and deduplication |
| Storage | Parseable on S3 | ~$0.023/GB/month with 80–90% compression on already-reduced volume |
| Querying | Parseable (SQL) | No per-query charges, no index maintenance costs |
Compare this to sending Bindplane's output to a SaaS observability platform at $2–$5/GB ingested. The savings are substantial.
Full MELT from a Single Backend
Bindplane can collect all four telemetry signal types (metrics, events, logs, traces). Parseable ingests all of them through the same OTLP endpoint, stored in unified Parquet format. Logs, metrics, and traces land in one backend, queryable with one SQL interface, correlated natively.
Open Standards, No Lock-In
Both systems are built on open standards. Bindplane is OpenTelemetry-native with 500+ source receivers. Parseable stores data in open Apache Parquet format on S3-compatible object storage. If you ever need to switch either component, you can — Bindplane can route to any OTLP destination, and Parseable's Parquet files can be read by Spark, DuckDB, Athena, or Trino. Bindplane also supports multi-destination routing, so you can fan out the same telemetry to Parseable, a SIEM, and cold storage simultaneously.
Configuration: Connecting Bindplane to Parseable
Step 1: Deploy Parseable
# Docker
docker run -p 8000:8000 \
  parseable/parseable:latest \
  parseable local-store

# Or use the Helm chart for Kubernetes
helm install parseable parseable/parseable
Step 2: Configure Bindplane's OTLP Destination
In Bindplane's UI or configuration, add an OTLP destination pointing to your Parseable instance:
| Setting | Value |
|---|---|
| Hostname | parseable.your-domain.com (or internal IP) |
| Port | 8000 |
| Protocol | HTTP |
| Compression | gzip |
| TLS | Enable for production |
Step 3: Add Parseable-Specific Headers
Parseable uses custom headers for stream routing and authentication:
headers:
  Authorization: "Basic <base64-encoded-credentials>"
  X-P-Stream: "bindplane-telemetry"
  X-P-Log-Source: "otel"
  Content-Type: "application/x-protobuf"
The X-P-Stream header tells Parseable which log stream to route incoming data to. You can create multiple Bindplane destinations pointing to different Parseable streams for logical separation (e.g., infra-logs, app-traces, system-metrics).
Step 4: Verify Data Flow
SELECT timestamp, body, severity_text, resource
FROM "bindplane-telemetry"
ORDER BY timestamp DESC
LIMIT 10;
AI Agent & LLM Observability
Infrastructure observability is a solved problem. AI observability is not — and the stakes are different.
Why Agents Need Observability
Traditional services follow deterministic code paths. AI agents don't. An agent might plan a five-step task, hit an error on step three, re-plan, call a tool that returns unexpected output, re-plan again, and eventually succeed — or loop indefinitely. The execution path is non-deterministic, which means:
- Silent failures — an agent can produce plausible-looking but wrong output without throwing an error
- Unpredictable costs — a single agent run might cost $0.02 or $40 depending on how many reasoning loops it enters
- Tool call cascades — one failed tool call can trigger a chain of retries, each consuming tokens
Without observability, you find out about these problems from your cloud bill or your users — not from your monitoring system.
The Triple Tax on Agent Costs
Every agent invocation incurs three cost layers: orchestration (the planning/reasoning LLM calls), execution (tool calls and sub-agent spawns), and processing (summarizing results, re-planning). Each layer consumes tokens independently, and costs compound non-linearly when agents enter retry loops. Tracking these costs requires telemetry at every layer — not just the top-level API call.
OpenTelemetry GenAI Semantic Conventions
The OpenTelemetry community has defined semantic conventions for GenAI systems that standardize how AI telemetry is recorded. These attributes appear on spans and are queryable as columns in Parseable:
| Attribute | Description | Example Value |
|---|---|---|
gen_ai.operation.name | Type of GenAI operation | chat, tool_call, agent_invoke |
gen_ai.agent.name | Name of the AI agent | code-reviewer, deploy-agent |
gen_ai.request.model | Model used for the request | claude-sonnet-4-20250514, gpt-4o |
gen_ai.system | GenAI provider | anthropic, openai |
gen_ai.usage.input_tokens | Tokens consumed by the prompt | 3200 |
gen_ai.usage.output_tokens | Tokens generated by the model | 850 |
gen_ai.request.temperature | Sampling temperature | 0.7 |
gen_ai.tool.name | Name of the tool called | file_search, code_execute |
When your agents and LLM gateways emit these attributes on OTel spans, Parseable stores them as structured columns in Parquet — fully queryable with SQL. The same interface you use to find crashing pods is the one you use to find runaway agents.
What Parseable Enables for AI Workloads
With AI telemetry flowing into Parseable, you can:
- Track cost per agent run — aggregate
input_tokensandoutput_tokensacross all spans in a trace, multiply by model pricing - Audit tool calls — query which tools were called, what they returned, and whether they succeeded
- Detect reasoning loops — identify traces with abnormally high span counts or token consumption
- Compare model performance — measure latency and output quality across providers and model versions
- Correlate agent failures with infrastructure events — trace from a tool call timeout back to the underlying service or pod that caused it
SQL Queries for Every Workload
Parseable stores all telemetry — infrastructure and AI — in the same SQL-queryable format. Here are five real questions teams ask, answered with SQL:
1. Which Kubernetes pods are crashing?
SELECT timestamp, resource['k8s.namespace.name'] as namespace,
       resource['k8s.pod.name'] as pod, body
FROM "k8s-logs"
WHERE body LIKE '%OOMKilled%'
  AND timestamp > NOW() - INTERVAL '1 hour'
ORDER BY timestamp DESC;
2. Which agent runs cost the most?
SELECT trace_id,
       span_attributes['gen_ai.agent.name'] as agent,
       span_attributes['gen_ai.request.model'] as model,
       SUM(span_attributes['gen_ai.usage.input_tokens']::bigint) as total_input_tokens,
       SUM(span_attributes['gen_ai.usage.output_tokens']::bigint) as total_output_tokens
FROM "ai-traces"
WHERE timestamp > NOW() - INTERVAL '24 hours'
GROUP BY trace_id, agent, model
ORDER BY total_input_tokens + total_output_tokens DESC
LIMIT 20;
3. Which tools fail most often?
SELECT span_attributes['gen_ai.tool.name'] as tool,
       COUNT(*) as total_calls,
       SUM(CASE WHEN status_code = 'ERROR' THEN 1 ELSE 0 END) as failures,
       ROUND(100.0 * SUM(CASE WHEN status_code = 'ERROR' THEN 1 ELSE 0 END) / COUNT(*), 1) as failure_pct
FROM "ai-traces"
WHERE span_attributes['gen_ai.operation.name'] = 'tool_call'
  AND timestamp > NOW() - INTERVAL '7 days'
GROUP BY tool
ORDER BY failure_pct DESC;
4. Which LLM model is slowest?
SELECT span_attributes['gen_ai.request.model'] as model,
       span_attributes['gen_ai.system'] as provider,
       COUNT(*) as calls,
       AVG(duration_ms) as avg_latency_ms,
       PERCENTILE_CONT(0.95) WITHIN GROUP (ORDER BY duration_ms) as p95_latency_ms
FROM "ai-traces"
WHERE span_attributes['gen_ai.operation.name'] = 'chat'
  AND timestamp > NOW() - INTERVAL '24 hours'
GROUP BY model, provider
ORDER BY avg_latency_ms DESC;
5. What's my daily AI spend?
SELECT DATE_TRUNC('day', timestamp) as day,
       span_attributes['gen_ai.request.model'] as model,
       SUM(span_attributes['gen_ai.usage.input_tokens']::bigint) as input_tokens,
       SUM(span_attributes['gen_ai.usage.output_tokens']::bigint) as output_tokens,
       -- Approximate cost (adjust rates per model)
       ROUND(SUM(span_attributes['gen_ai.usage.input_tokens']::bigint) * 0.000003
           + SUM(span_attributes['gen_ai.usage.output_tokens']::bigint) * 0.000015, 2) as estimated_cost_usd
FROM "ai-traces"
WHERE timestamp > NOW() - INTERVAL '30 days'
GROUP BY day, model
ORDER BY day DESC, estimated_cost_usd DESC;
Five different questions. Two completely different workload types. One query language. One backend.
Why One Backend Matters
Most teams today use separate tools for each observability concern:
- Infrastructure logs → Elasticsearch or Splunk
- APM/traces → Datadog or New Relic
- Agent monitoring → LangSmith or custom dashboards
- LLM cost tracking → spreadsheets or billing APIs
That's four tools, four bills, four query languages, and zero correlation between them. When an agent's tool call times out, you can't easily trace that timeout to the underlying Kubernetes pod that OOM-killed the service it was calling — because the data lives in different systems.
The Parseable approach: every signal, every source, one backend. SQL for everything. S3 at ~$0.023/GB/month. One bill.
The correlation superpower is real. With all telemetry in one Parseable instance, you can trace from an agent tool call failure → to the HTTP span showing a 503 → to the Kubernetes log showing the target pod was OOMKilled — all in one query session. No context-switching. No exporting CSVs. No guessing.
All your telemetry data. One question away.
Getting Started
1. Deploy Parseable
Single binary, Docker, or Helm chart:
docker run -p 8000:8000 \
  parseable/parseable:latest \
  parseable local-store
For Kubernetes: helm install parseable parseable/parseable
2. Infrastructure: Configure Bindplane OTLP Destination
Point Bindplane's OTLP destination at http://parseable:8000/v1/logs with the X-P-Stream and Authorization headers (see configuration section above). All infrastructure telemetry starts flowing immediately.
3. AI Agents: Instrument with OTel SDK + GenAI Conventions
Add OpenTelemetry instrumentation to your agents using the GenAI semantic conventions. Export spans through an OTel Collector configured with an OTLP exporter pointed at the same Parseable instance.
4. LLM Gateways: Enable LiteLLM OTEL Callback
If you use LiteLLM as your LLM gateway, enable the OpenTelemetry callback to export trace data for every LLM call — including token usage, latency, and model routing decisions.
5. Start Querying with SQL
Logs, metrics, traces, agent telemetry, and LLM cost data — all in one place, all queryable with SQL.
Further Reading
- Tracing Coding Agents with Parseable — End-to-end agent trace instrumentation
- Understanding Coding Agents: How and Where to Instrument — Agent anatomy and telemetry strategy
- Understanding Cost Implications of Agents — The triple tax on agentic tool calls
- LiteLLM Trace Analysis with Parseable — LLM gateway observability
- Ingesting Kubernetes Logs with OTel Collector — Infrastructure telemetry pipeline setup
Parseable is an open-source, unified observability platform built in Rust. It ingests logs, metrics, traces, and AI telemetry through native OTLP endpoints, stores everything on S3 in Apache Parquet format, and lets you query with SQL. One binary. One interface. Infrastructure and AI — together.

