

An OpenTelemetry Collector pod can pass its health check while an exporter queue fills. Kubernetes keeps the process running because the endpoint responds, but the Collector may already be refusing new data or waiting on a slow backend.
Internal metrics expose that part of the failure. For a one-record setup test, the Collector debug exporter is faster; internal metrics are the production view once traffic and queues matter.
OTel Collector metrics describe the health of the Collector process and the telemetry moving through its pipelines. They show whether receivers accept data, processors pass it through, exporters send it and queues have enough capacity. The Collector exposes these metrics on a Prometheus endpoint at http://127.0.0.1:8888/metrics by default.
This guide builds a small operational dashboard around those signals. If receivers, processors and exporters are still new, begin with the OpenTelemetry Collector guide. This article assumes that pipeline model and stays with monitoring it.
Three things called Collector monitoring
These three signals answer different questions and should not share a label on a runbook.
| Signal | What it tells you | What it cannot prove |
|---|---|---|
| Internal metrics | Whether the process and telemetry pipeline are healthy | Why an individual application request failed |
health_check extension | Whether the Collector responds to a liveness or readiness probe | Whether data is reaching the backend |
| Application and host metrics | Whether the systems being observed are healthy | Whether the Collector delivering those metrics is healthy |
The distinction matters during an incident. A 200 OK from port 13133 confirms that the health-check endpoint responded. It does not confirm that the exporter is keeping up. The upstream health_check extension also warns that its check_collector_pipeline option does not work as expected, so do not treat it as a substitute for pipeline telemetry.
Host metrics create another common mix-up. The hostmetrics receiver may collect CPU and memory from a machine, but those values describe the host. Metrics such as otelcol_process_memory_rss describe the Collector process itself.
How to expose OTel Collector metrics
The Collector exposes internal metrics at 127.0.0.1:8888/metrics with normal verbosity by default. On the same machine, check the endpoint with:
curl http://127.0.0.1:8888/metricsContainers and Kubernetes scrapers usually need the endpoint bound to a reachable interface. Current Collector releases configure that through a Prometheus reader:
service:
  telemetry:
    metrics:
      level: normal
      readers:
        - pull:
            exporter:
              prometheus:
                host: 0.0.0.0
                port: 8888
                without_type_suffix: true
                without_units: true
Restrict access to port 8888 with network policy or firewall rules. Internal telemetry includes component names, endpoints and other operational labels that do not need to be public.
Older examples use this setting:
service:
  telemetry:
    metrics:
      address: 0.0.0.0:8888
The Collector has ignored service.telemetry.metrics.address since v0.123.0. If a copied configuration fails to expose the endpoint where expected, check its age before debugging the network.
The without_type_suffix and without_units options keep the shorter metric names used in this article. Without them, Prometheus may expose otelcol_process_uptime as otelcol_process_uptime_seconds_total, for example. OTLP exports use the unsuffixed instrument name.
The dashboard should answer five questions
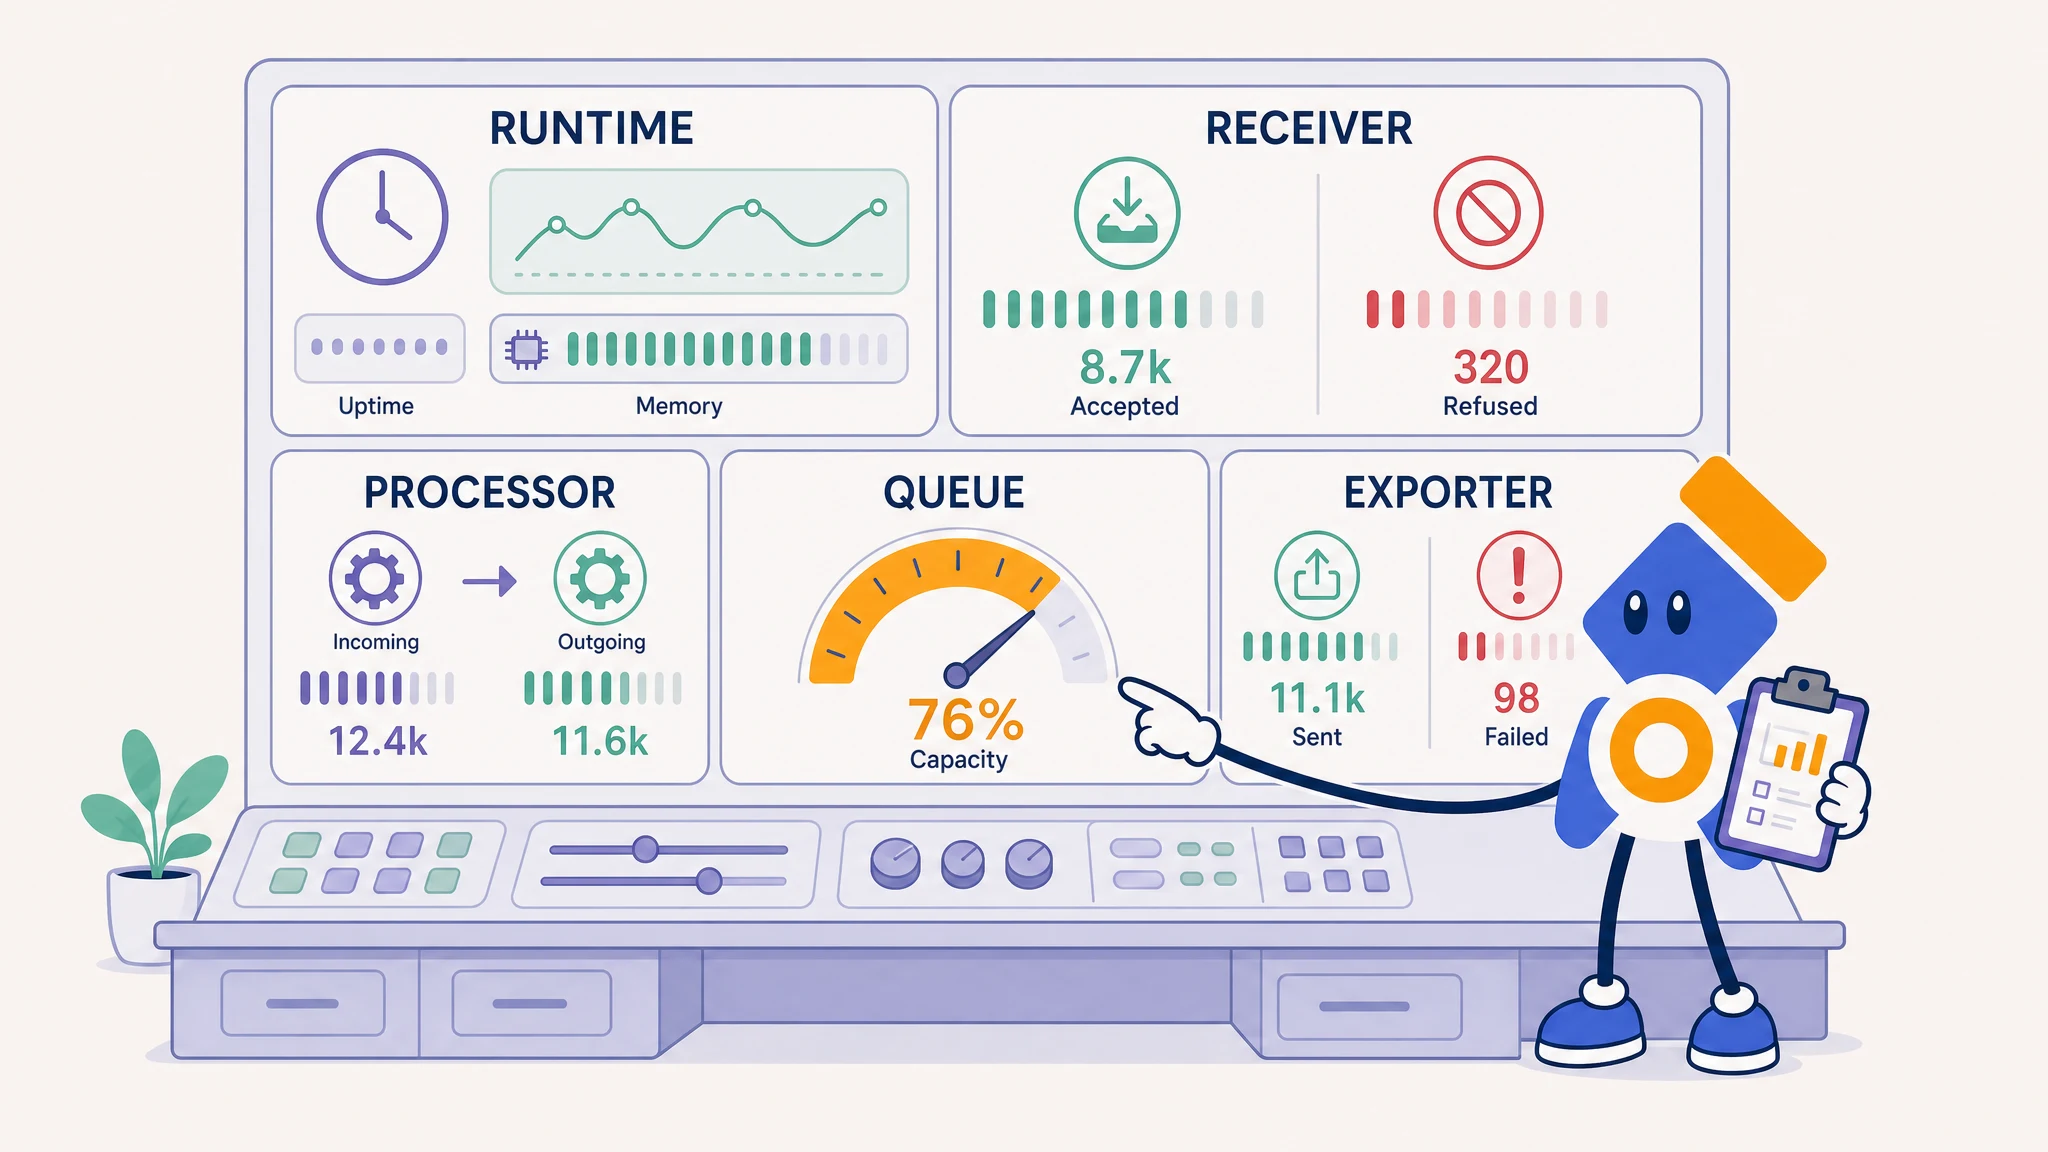
A useful OTel Collector dashboard follows data through the pipeline. Start with five rows or groups: process, receiver, processor, exporter queue and exporter outcome.
The same layout works in a Grafana dashboard or in your observability backend. The useful part is the sequence, because it lets an engineer move from a missing signal to the failing stage without opening every panel on the page.
If you want a working starting point instead of building every panel by hand, import the Parseable OTel Collector metrics dashboard. It follows the same process, receiver, processor, queue and exporter sequence used below.
Is the Collector staying up?
Start with process health:
otelcol_process_uptimeotelcol_process_cpu_secondsotelcol_process_memory_rssotelcol_process_runtime_heap_alloc_bytes
An uptime counter returning to zero reveals a restart. Rising resident memory or heap allocation gives the restart context. CPU and memory alone do not show a broken pipeline, but they tell you whether the Collector is approaching the resource limits around it.
Graph memory beside the container limit rather than by itself. A Collector using 1 GiB might be comfortable in an 8 GiB pod and minutes away from eviction in a 1.2 GiB pod.
If memory climbs while an exporter queue grows, investigate the downstream destination before raising the limit. The memory limiter processor guide explains how the Collector applies backpressure before memory pressure ends in an out-of-memory kill.
Are receivers accepting telemetry?
Receivers expose accepted and refused counters for each signal:
otelcol_receiver_accepted_log_records
otelcol_receiver_accepted_metric_points
otelcol_receiver_accepted_spans

otelcol_receiver_refused_log_records
otelcol_receiver_refused_metric_points
otelcol_receiver_refused_spans
Use a rate over a short window instead of graphing the raw counter. For spans:
sum by (receiver) (
  rate(otelcol_receiver_accepted_spans[5m])
)
Accepted traffic dropping to zero is not automatically an incident. Overnight traffic may genuinely disappear. Alert when the drop breaks an expected baseline or when upstream services report traffic while the Collector accepts none.
Refused telemetry is less ambiguous. A rising refused counter means the receiver could not push data into the pipeline. Memory pressure, a saturated downstream component or internal backpressure may be responsible.
sum by (receiver) (
  rate(otelcol_receiver_refused_spans[5m])
) > 0
Repeat the query for log_records and metric_points or build the dashboard from a template variable when the backend supports it.
Are processors changing the flow as expected?
The general processor counters are:
otelcol_processor_incoming_items
otelcol_processor_outgoing_items
They help locate the stage where volume changes. A filter or sampling processor is supposed to emit fewer items than it receives. A batch processor changes request shape without intending to discard telemetry. Context decides whether a difference is loss.
This is why a single ingress-versus-egress percentage can mislead. Tail sampling drops spans by policy. A connector can turn traces into metrics. A routing processor can send records to different exporters. Compare adjacent stages and annotate expected transformations instead of assuming every item must leave through one exporter.
Component-specific metrics add detail. The batch processor, for example, reports batch sizes and whether size or timeout triggered a send at normal verbosity. Use detailed only when the extra dimensions solve a real investigation; more labels also increase monitoring cost.
Are exporter queues running out of room?
Exporter queues absorb a temporary gap between incoming traffic and backend throughput. The Collector exporters guide covers queue and retry configuration at the destination boundary. Two gauges show their state:
otelcol_exporter_queue_size
otelcol_exporter_queue_capacity
Queue size is easiest to read as a utilization ratio:
max by (exporter) (
  otelcol_exporter_queue_size
  /
  otelcol_exporter_queue_capacity
)
A queue reaching 60 percent and draining is doing its job. A queue holding 60 percent for thirty minutes is accumulating debt. Alert on a sustained high ratio and its direction rather than one universal number.
Also watch:
otelcol_exporter_enqueue_failed_log_records
otelcol_exporter_enqueue_failed_metric_points
otelcol_exporter_enqueue_failed_spans
An enqueue failure means telemetry could not enter the sending queue. At that point, capacity is no longer a theoretical concern. The Collector data loss guide explains how queue sizing, retries and persistent storage affect this failure path.
Are exporters delivering data?
Successful export counters describe what reached a destination:
otelcol_exporter_sent_log_records
otelcol_exporter_sent_metric_points
otelcol_exporter_sent_spans
Failed-send counters describe export attempts that did not succeed:
otelcol_exporter_send_failed_log_records
otelcol_exporter_send_failed_metric_points
otelcol_exporter_send_failed_spans
A practical panel graphs both rates by exporter. Failed sends rising while the queue remains low can mean retries are recovering quickly. Failed sends rising with a growing queue suggests the destination cannot keep up or cannot be reached.
sum by (exporter) (
  rate(otelcol_exporter_send_failed_spans[5m])
)
Inspect Collector logs alongside this metric. DNS failures, authentication errors, TLS problems, rate limits and backend timeouts can all produce the same rising counter.
A small alert set that earns its keep
Do not create an alert for every internal metric. Start with failure signals that have an owner and a clear response.
| Alert | Condition | First check |
|---|---|---|
| Collector restarted | Uptime resets unexpectedly | Pod events, memory limit and Collector logs |
| Receiver refusing data | Refused rate stays above zero | Memory pressure and the next pipeline component |
| Queue pressure | Queue ratio stays above the deployment baseline and keeps rising | Backend latency, rate limits and exporter throughput |
| Queue rejected data | Enqueue-failed rate rises above zero | Queue capacity, persistent storage and destination health |
| Export failures | Send-failed rate remains above zero | Credentials, DNS, TLS and backend availability |
| Silent pipeline | Accepted or sent rate falls outside the expected traffic baseline | Upstream traffic, receiver bindings and pipeline activation |
Keep the evaluation window long enough to ignore a rolling restart or one failed request, but short enough to respond before the queue fills. The right window follows your traffic and queue capacity. A low-volume edge Collector and a regional gateway should not share thresholds merely because they run the same binary.
Monitor every Collector instance
Aggregating every replica into one line can hide a sick instance behind healthy peers. Preserve at least these resource attributes or scrape labels:
service.nameservice.versionservice.instance.id- cluster, namespace and pod identity in Kubernetes
Use the aggregate view for service-level capacity, then keep a per-instance view for imbalance and restart diagnosis. One gateway may own a full queue while the fleet average looks comfortable.
On Kubernetes, expose port 8888 from each Collector pod and let your metrics system discover every endpoint. Keep the liveness probe on the health_check endpoint, commonly port 13133, but do not make it your only alert. Probe health and data-path health are separate panels.
If you use the Prometheus Operator, a PodMonitor can discover every Collector replica without maintaining a static target list:
apiVersion: monitoring.coreos.com/v1
kind: PodMonitor
metadata:
  name: otel-collector
spec:
  selector:
    matchLabels:
      app.kubernetes.io/name: opentelemetry-collector
  podMetricsEndpoints:
    - port: metrics
      path: /metrics
      interval: 15s
The Collector pod must expose port 8888 with the port name metrics. Adjust the label selector to match the labels applied by your deployment or Helm chart.
Avoid asking a broken Collector to report itself
Sending internal telemetry through the same Collector and exporter being monitored creates a blind spot. When that exporter fails, its failure metric can become trapped behind the failure.
For development, self-export is convenient. For a production gateway, scrape its Prometheus endpoint from an independent monitoring path. A second Collector or metrics scraper can collect port 8888 from the workload Collectors and export those metrics to the backend.
receivers:
  prometheus/collector_health:
    config:
      scrape_configs:
        - job_name: otel-collectors
          scrape_interval: 15s
          static_configs:
            - targets:
                - gateway-a:8888
                - gateway-b:8888

exporters:
  otlp_http/parseable:
    metrics_endpoint: ${env:PARSEABLE_URL}/v1/metrics
    encoding: json
    headers:
      X-API-Key: ${env:PARSEABLE_API_KEY}
      X-P-Stream: otel-collector-health
      X-P-Log-Source: otel-metrics

service:
  pipelines:
    metrics/collector_health:
      receivers: [prometheus/collector_health]
      exporters: [otlp_http/parseable]
This monitoring Collector belongs in a different failure domain where possible. If both instances share the same pod, node and network path, one outage can still remove the evidence.
Parseable accepts OTLP metrics at /v1/metrics, where you can graph queue utilization, group failures by Collector instance and alert on sustained rates. The OpenTelemetry and Parseable stack guide covers the wider logs, metrics and traces pipeline. Check the Parseable OTLP metrics documentation for current authentication and ingestion settings.
Troubleshoot the pipeline in order
When telemetry disappears, follow the same path the data should take:

- Confirm that the expected Collector instance is running and has not restarted.
- Check accepted and refused receiver rates.
- Compare processor input and output where a transformation may remove data.
- Check exporter queue utilization and enqueue failures.
- Compare sent and send-failed rates.
- Read Collector logs for the named component and destination error.
If receiver counters stay flat, verify the application's endpoint and the receiver's pipeline membership. If receivers accept data but exporters send none, work forward through processors and queues. The official Collector troubleshooting guide also covers the debug exporter, zPages and component inspection when metrics narrow the problem but do not explain it.
The dashboard does not need to be large. It needs to preserve the path from intake to delivery, identify the affected instance and keep reporting when the production Collector cannot.