
The worst OpenTelemetry failures are the quiet ones.
The service says it emitted spans. The Collector process is up. The backend token came from the right secret. The dashboard is still blank. At this point, people start editing YAML like they are defusing something: switch the endpoint, rename a stream, restart the Collector, change the SDK env vars, toggle JSON vs protobuf, try again. Sometimes one of those changes works. Most of the time, the team has only made the system harder to reason about.
The better move is to ask a smaller question: did the telemetry reach this point in the Collector pipeline? The OpenTelemetry debug exporter exists for exactly that moment. It prints telemetry from a pipeline to the Collector output, so you can separate "the application never sent it" from "the Collector received it but the backend export path is broken." It is one of the fastest ways to stop guessing.
The OpenTelemetry Collector debug exporter is a diagnostic component that prints telemetry reaching the end of a Collector pipeline. It is not a backend, a processor, or a stable API to scrape. It supports basic, normal and detailed verbosity and it can print traces, metrics, logs and profiles when the Collector distribution includes the component. Treat the output as something for engineers to read while debugging, not as a contract for automation or a substitute for a real observability store.
Why it exists
An OpenTelemetry Collector pipeline is simple on paper: receiver -> processor(s) -> exporter(s). A receiver accepts telemetry, processors change or buffer it and exporters send the result somewhere else. The trouble is that a working-looking Collector config can still lose the plot in several places. The application may not emit. The SDK may point to the wrong host. The receiver may listen on gRPC while the client sends HTTP. A processor may drop the record. The backend exporter may have the wrong path, token, header, encoding, or dataset.
The debug exporter cuts that search space down. If it prints the data, the receiver and everything before the exporter are alive. You can stop arguing with the SDK endpoint and start looking at the real exporter or backend. If it prints nothing, do not burn time rotating tokens or renaming streams. Stay upstream: protocol, port, service routing, SDK enablement, flush behavior and pipeline wiring. The official Collector troubleshooting guide covers the broader diagnostic path.
application -> Collector receiver -> processors -> debug exporter -> Collector outputWhere it fits in the Collector
The component type is debug. The official debug exporter reference lists it in the upstream core, contrib and Kubernetes Collector distributions. A custom Collector binary only has the components compiled into it. That distinction is worth remembering when a config works locally and fails in a hardened internal image. Sometimes the YAML is fine; the binary simply does not contain the exporter you are trying to use.
You may also see older Collector examples using the logging exporter for the same job. Treat that as old config. Modern Collector versions use debug for this path and configs that still reference logging should be moved to debug when you upgrade. This is an easy migration to miss because both names sound like they should print telemetry, but the component name the Collector recognizes depends on the version you are running.
Defining the exporter is also not enough. Collector configuration has two jobs: define components, then activate them under service.pipelines. This catches people because the Collector can start with a valid exporters.debug block and still never send anything to it. The pipeline is the truth. If the pipeline does not name the component, that component is configuration sitting on the shelf.
exporters:
  debug:
    verbosity: basic

service:
  pipelines:
    traces:
      receivers: [otlp]
      processors: [batch]
      exporters: [debug]
Read the pipeline from the bottom when debugging. service.pipelines.traces tells you which receiver accepts spans, which processors run and which exporters receive the processed spans. If you send logs but only configured a traces pipeline, debug will not print those logs. If you define debug/detailed but reference debug, you are using a different exporter instance. Collector component names are literal; close enough is still wrong.
Run the smallest useful test
Start with the smallest thing that can answer the question. One Collector. One OTLP receiver. One batch processor if you want to keep the shape close to a real pipeline. One debug exporter. No backend token, no queue tuning, no routing rules, no clever transform. A boring config is a feature here because every extra component becomes another suspect.
Save this as otel-collector.yaml:
receivers:
  otlp:
    protocols:
      grpc:
        endpoint: 0.0.0.0:4317
      http:
        endpoint: 0.0.0.0:4318

processors:
  batch:

exporters:
  debug:
    verbosity: basic

service:
  pipelines:
    traces:
      receivers: [otlp]
      processors: [batch]
      exporters: [debug]
    metrics:
      receivers: [otlp]
      processors: [batch]
      exporters: [debug]
    logs:
      receivers: [otlp]
      processors: [batch]
      exporters: [debug]
Run the Collector with a version you have actually tested. This example uses 0.161.0, the version tested for this guide. Collector upgrades can change component behavior, defaults, available components and debug output formatting. Check the official Docker installation guide and test a newer version before changing the tag in a shared environment.
docker run --rm \
  -p 127.0.0.1:4317:4317 \
  -p 127.0.0.1:4318:4318 \
  -v "$PWD/otel-collector.yaml:/etc/otelcol-contrib/config.yaml:ro" \
  otel/opentelemetry-collector-contrib:0.161.0
If you have telemetrygen installed, send one trace through the gRPC receiver. You are not load testing. You are proving a route. The Collector output should show a short line for traces with the component id, signal and span count. The exact string can vary by Collector version, so focus on the facts it carries rather than the formatting.
telemetrygen traces \
  --otlp-endpoint localhost:4317 \
  --otlp-insecure \
  --traces 1
info Traces {"otelcol.component.id": "debug", "otelcol.signal": "traces", "resource spans": 1, "spans": 1}That one line is enough to move the investigation. The test trace reached the traces pipeline and made it to the exporter. If the line does not appear, do not add the backend yet. Check whether the sender is using OTLP/gRPC on 4317 or OTLP/HTTP on 4318, whether the Collector port is reachable from the sender and whether the pipeline for that signal actually references both the otlp receiver and the debug exporter.
Where debug output appears
With use_internal_logger: true, debug records go to the Collector process output. The command you use to read them depends on how the Collector runs:
# Docker
docker logs <collector-container>

# Kubernetes
kubectl logs <collector-pod> -c otel-collector

# systemd
journalctl -u otelcol-contrib
Use your actual container name, pod name and systemd unit. If a platform redirects stdout or the Collector logger writes elsewhere, inspect that destination instead.
Choose the right verbosity
The setting that matters most is verbosity. The default is basic and that is where most investigations should begin. It prints a compact count for each received batch, which is enough to prove flow without turning the Collector log into a data dump. normal gives you a more readable view of individual records. detailed shows much more of the payload: resource attributes, scope information, span or log fields, metric data points and value types.
| Verbosity | What it prints | When to use it |
|---|---|---|
basic | A single-line summary with counts for each received batch | Checking that data is flowing without filling the terminal |
normal | A compact view, roughly one line per telemetry record | Reading span names, resource identity or log summaries |
detailed | The full details of each telemetry record, usually over many lines | Inspecting attributes, types, trace IDs, metric points and processor output |
Read detailed output
Detailed output earns its keep when the question changes from "is there data?" to "what shape is the data?" It exposes the OpenTelemetry hierarchy more plainly than many backend UIs do. Resource attributes describe the entity that produced telemetry. Span, log and metric attributes describe a single telemetry record. That difference matters because a field can be present and still be in the wrong place for grouping, querying, or backend routing.
ResourceSpans #0
Resource attributes:
     -> service.name: Str(checkout-api)
ScopeSpans #0
InstrumentationScope checkout-api
Span #0
    Trace ID       : 5b8aa5a2d2c872e8321cf37308d69df2
    ID             : 051581bf3cb55c13
    Name           : POST /checkout
    Kind           : Server
Attributes:
     -> http.request.method: Str(POST)
     -> http.response.status_code: Int(500)
The same output helps catch type bugs early. The value 500 and the string "500" do not behave the same in every processor or query engine. When detailed prints Int(500), Str(500), Bool(false), or another typed value, you can verify whether the SDK, receiver, or transform produced the shape your backend expects. This is the kind of bug that looks obvious after you find it and wastes an afternoon before you do.
Keep debug output safe
The configuration surface is small, but two sampling settings are worth knowing before you turn this on in a noisy environment. sampling_initial controls how many messages are logged at first each second. sampling_thereafter controls how often messages are logged after that initial burst and 1 means sampling is disabled. These settings sample the debug exporter's own log output; they do not sample or drop telemetry for the rest of the pipeline.
| Setting | Default | Notes |
|---|---|---|
verbosity | basic | One of basic, normal or detailed |
sampling_initial | 2 | Number of messages initially logged each second |
sampling_thereafter | 1 | After the initial messages, log every Mth message; 1 means sampling is disabled |
use_internal_logger | true | Uses the Collector internal logger for output |
output_paths | ["stdout"] | Only valid when use_internal_logger is false; supports stdout, stderr or file paths |
sending_queue | disabled | Uses the common exporter helper queue settings |
For a noisy pipeline, sample the debug output instead of flooding the Collector logs. Sampling keeps the exporter readable while still giving you evidence that records are flowing. It does not make detailed safe for unrestricted production traffic and it does not reduce what flows to other exporters. It only controls how much the debug exporter writes.
exporters:
  debug:
    verbosity: detailed
    sampling_initial: 5
    sampling_thereafter: 200
If you need debug output somewhere other than the Collector logger, disable the internal logger first and set output_paths. Setting output_paths while use_internal_logger is true is a configuration error. File output is best kept to short, controlled investigations, because it can contain the same sensitive values as the Collector logs: customer identifiers, headers, SQL statements, log bodies and anything else your telemetry carries.
Kubernetes needs one more guardrail. If the Collector also reads container logs, exclude its own pod logs before enabling the debug exporter. Otherwise, it can ingest its debug output, print that record again and create a feedback loop. The official Collector Helm chart documentation calls out this log-explosion risk. Keep detailed output away from production traffic unless the investigation is controlled and short.
One subtle detail: with use_internal_logger: true, the debug exporter writes through the Collector's own logger. That means Collector logging settings under service.telemetry.logs can affect what you see. If you expected detailed debug output and the terminal stays quiet, check the pipeline first, then check the Collector's own log configuration before assuming the exporter is broken.
exporters:
  debug/file:
    verbosity: detailed
    use_internal_logger: false
    output_paths:
      - /tmp/otel-debug-output.log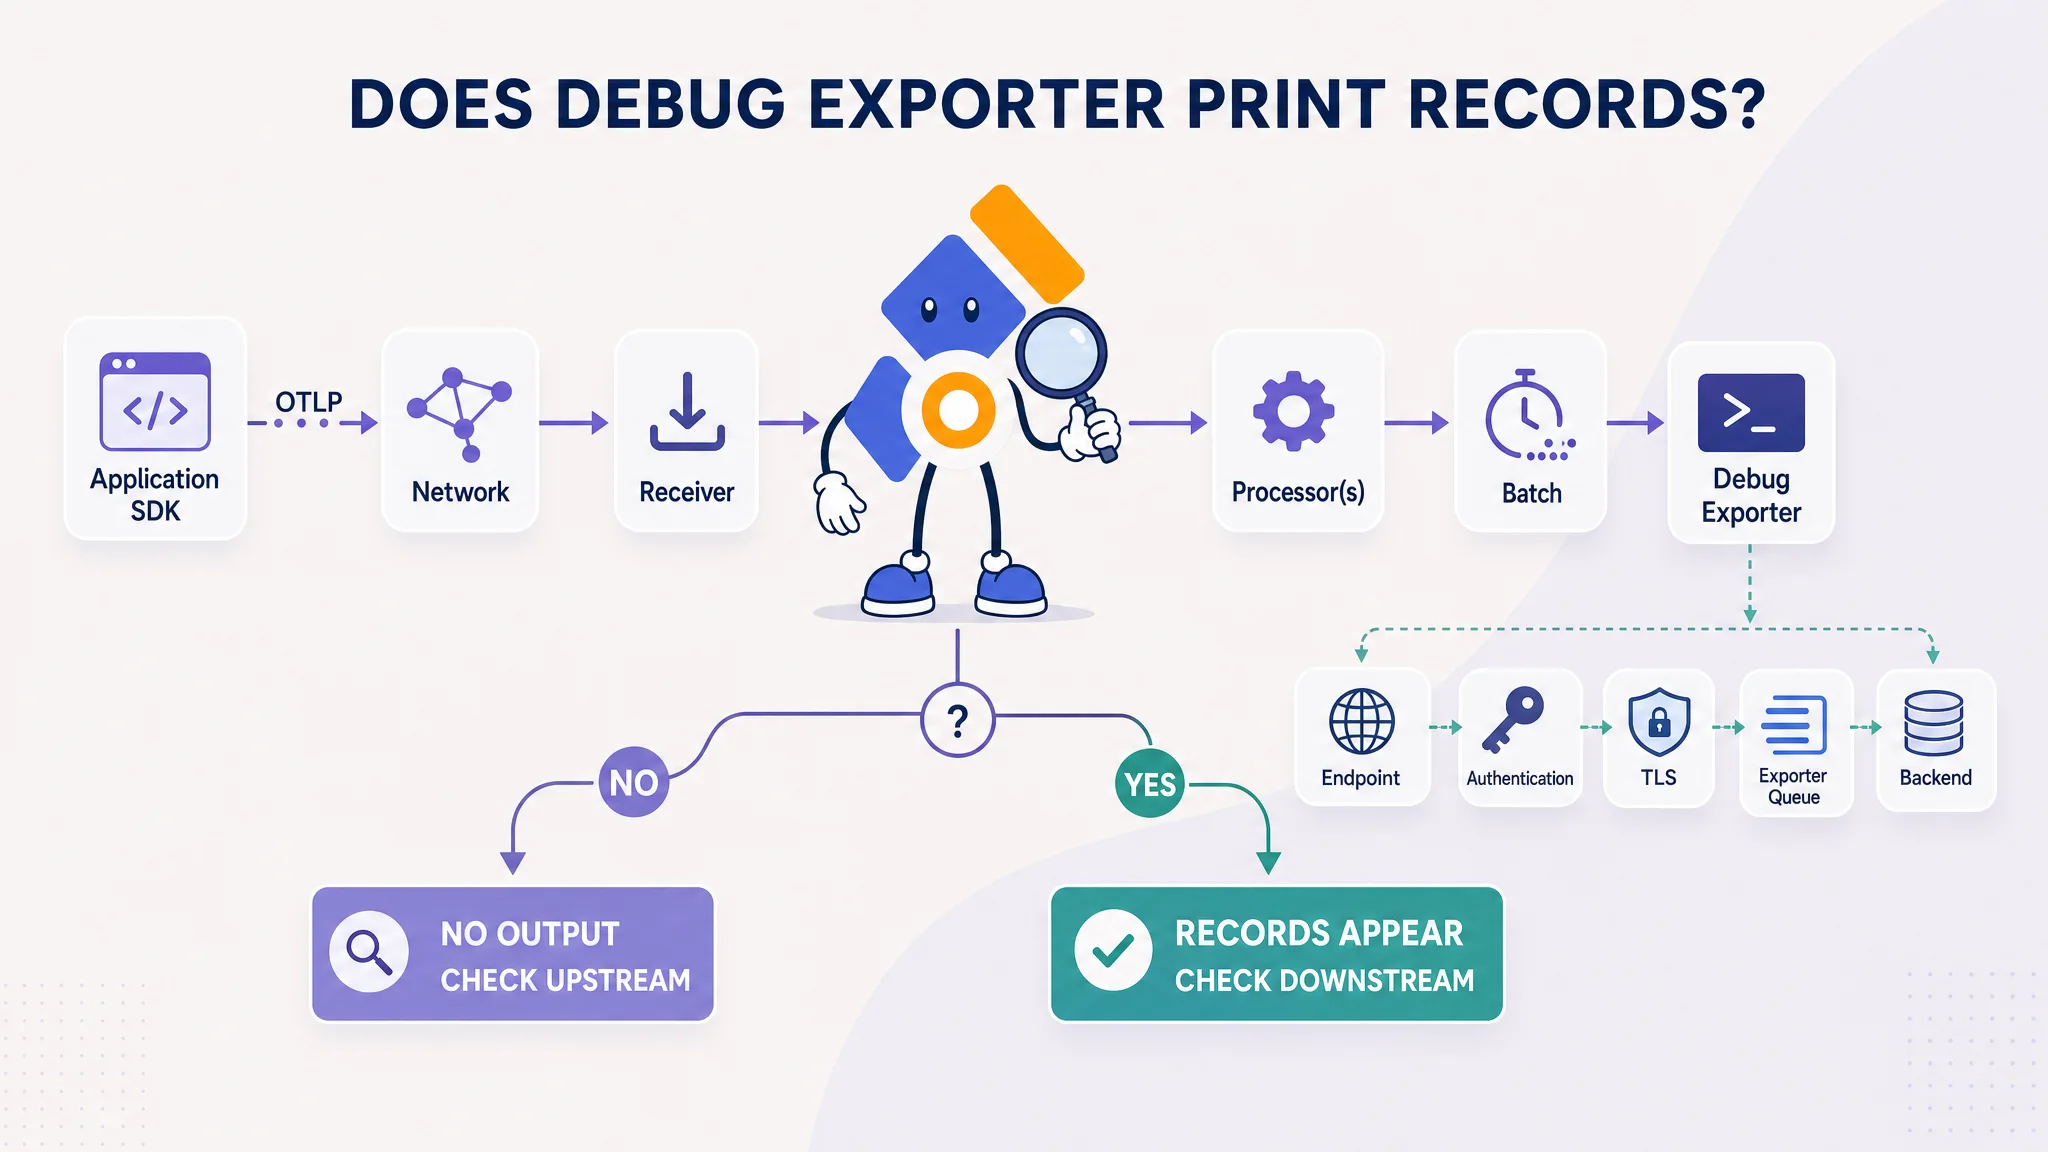
Debugging workflows
Use this table before changing several parts of the pipeline at once:
| What you see | Most likely search area | Check next |
|---|---|---|
| No debug output | Application-to-Collector path | SDK export, OTLP protocol and port, network route, receiver, signal pipeline |
| Debug records appear, backend remains empty | Backend export path | Endpoint, auth, TLS, signal path, queue, retry and backend rejection |
| Records have wrong fields or types | Instrumentation or processors | Resource placement, attribute types, transform, filter and redaction rules |
| Counts stop or fall under load | Capacity or sampling | Refused telemetry, queue metrics, memory pressure and sampling configuration |
The first workflow is the one you should do before the argument starts: prove the application is sending telemetry. Remove the real backend. Strip the pipeline down. Point one service, one script, or one telemetrygen command at the Collector and use debug at basic verbosity. If the exporter prints spans, logs, or metrics, the application is emitting and the receiver can accept the signal. If it prints nothing, stay upstream and check endpoint, protocol mismatch, container networking, Kubernetes service routing, SDK enablement and flush behavior.
receivers:
  otlp:
    protocols:
      grpc:
        endpoint: 0.0.0.0:4317

exporters:
  debug:
    verbosity: basic

service:
  pipelines:
    traces:
      receivers: [otlp]
      exporters: [debug]
The second workflow is processor verification. Processors can fail in ways that look like backend problems. A resource processor may add an attribute to the wrong signal pipeline. A transform may turn a number into a string. A filter may drop far more records than intended. Put debug after the processors and use detailed just long enough to inspect the processed result. Then turn it back down.
processors:
  resource/environment:
    attributes:
      - key: deployment.environment.name
        value: staging
        action: upsert
  batch:

exporters:
  debug/processed:
    verbosity: detailed

service:
  pipelines:
    logs:
      receivers: [otlp]
      processors: [resource/environment, batch]
      exporters: [debug/processed]
If you need both raw and processed views, remember that an exporter always runs at the end of a pipeline. You cannot place debug in the middle of one pipeline and continue processing after it. To compare before and after states, use two pipelines connected by an internal OTLP hop. The first pipeline prints the raw records and forwards them to the internal receiver. The second pipeline receives the same data, runs processors and prints the processed version.
receivers:
  otlp:
    protocols:
      grpc:
        endpoint: 0.0.0.0:4317

  otlp/internal:
    protocols:
      grpc:
        endpoint: 127.0.0.1:4316

processors:
  resource/environment:
    attributes:
      - key: deployment.environment.name
        value: staging
        action: upsert
  batch:

exporters:
  debug/raw:
    verbosity: normal

  debug/processed:
    verbosity: detailed

  otlp/internal:
    endpoint: 127.0.0.1:4316
    tls:
      insecure: true

service:
  pipelines:
    logs/raw:
      receivers: [otlp]
      exporters: [debug/raw, otlp/internal]

    logs/processed:
      receivers: [otlp/internal]
      processors: [resource/environment, batch]
      exporters: [debug/processed]
During a backend rollout, keep debug beside the real exporter only for a short window. If the debug count rises but the backend remains empty, the receiver and processors are probably not the first problem. Focus on the backend exporter: endpoint, signal path, token, headers, TLS, encoding, retries, queue behavior, or backend-side routing. The Collector exporters guide covers those outbound settings. Once the backend receives data, remove debug or drop it back to the smallest output that still serves a purpose.
exporters:
  debug:
    verbosity: basic

  otlp_http/backend:
    endpoint: ${env:OTLP_BACKEND_URL}
    headers:
      Authorization: Bearer ${env:OTLP_TOKEN}

service:
  pipelines:
    traces:
      receivers: [otlp]
      processors: [batch]
      exporters: [debug, otlp_http/backend]
For persistent failures under load, inspect Collector internal metrics and the Collector data loss guide. The debug exporter proves that records reached one point; it cannot prove that queues, retries, or storage will survive an outage.
Final thoughts
The debug exporter is easy to underestimate because it does not look like a production feature. It does not store data, create dashboards, send alerts, or correlate signals. Its value is narrower: it tells you whether telemetry reached a known point in the Collector pipeline. That is often the first question worth answering, because it cuts away a lot of guessing before anyone starts changing backend config.
Keep the workflow boring and repeatable. Start with basic, send one known telemetry item and decide what the output proves. Move to normal or detailed only when you need attributes, types, or processor output. If nothing prints, look at the application, network, receiver and pipeline wiring. If it prints, move downstream to exporter config, credentials, endpoint shape and backend routing. Remove or turn down the debug exporter once the pipeline is proven.