OpenTelemetry is the open-source standard many teams use to generate, collect and move logs, metrics and traces without wiring every application to a single vendor. The OpenTelemetry Collector receives that telemetry, shapes it, and sends it onward.
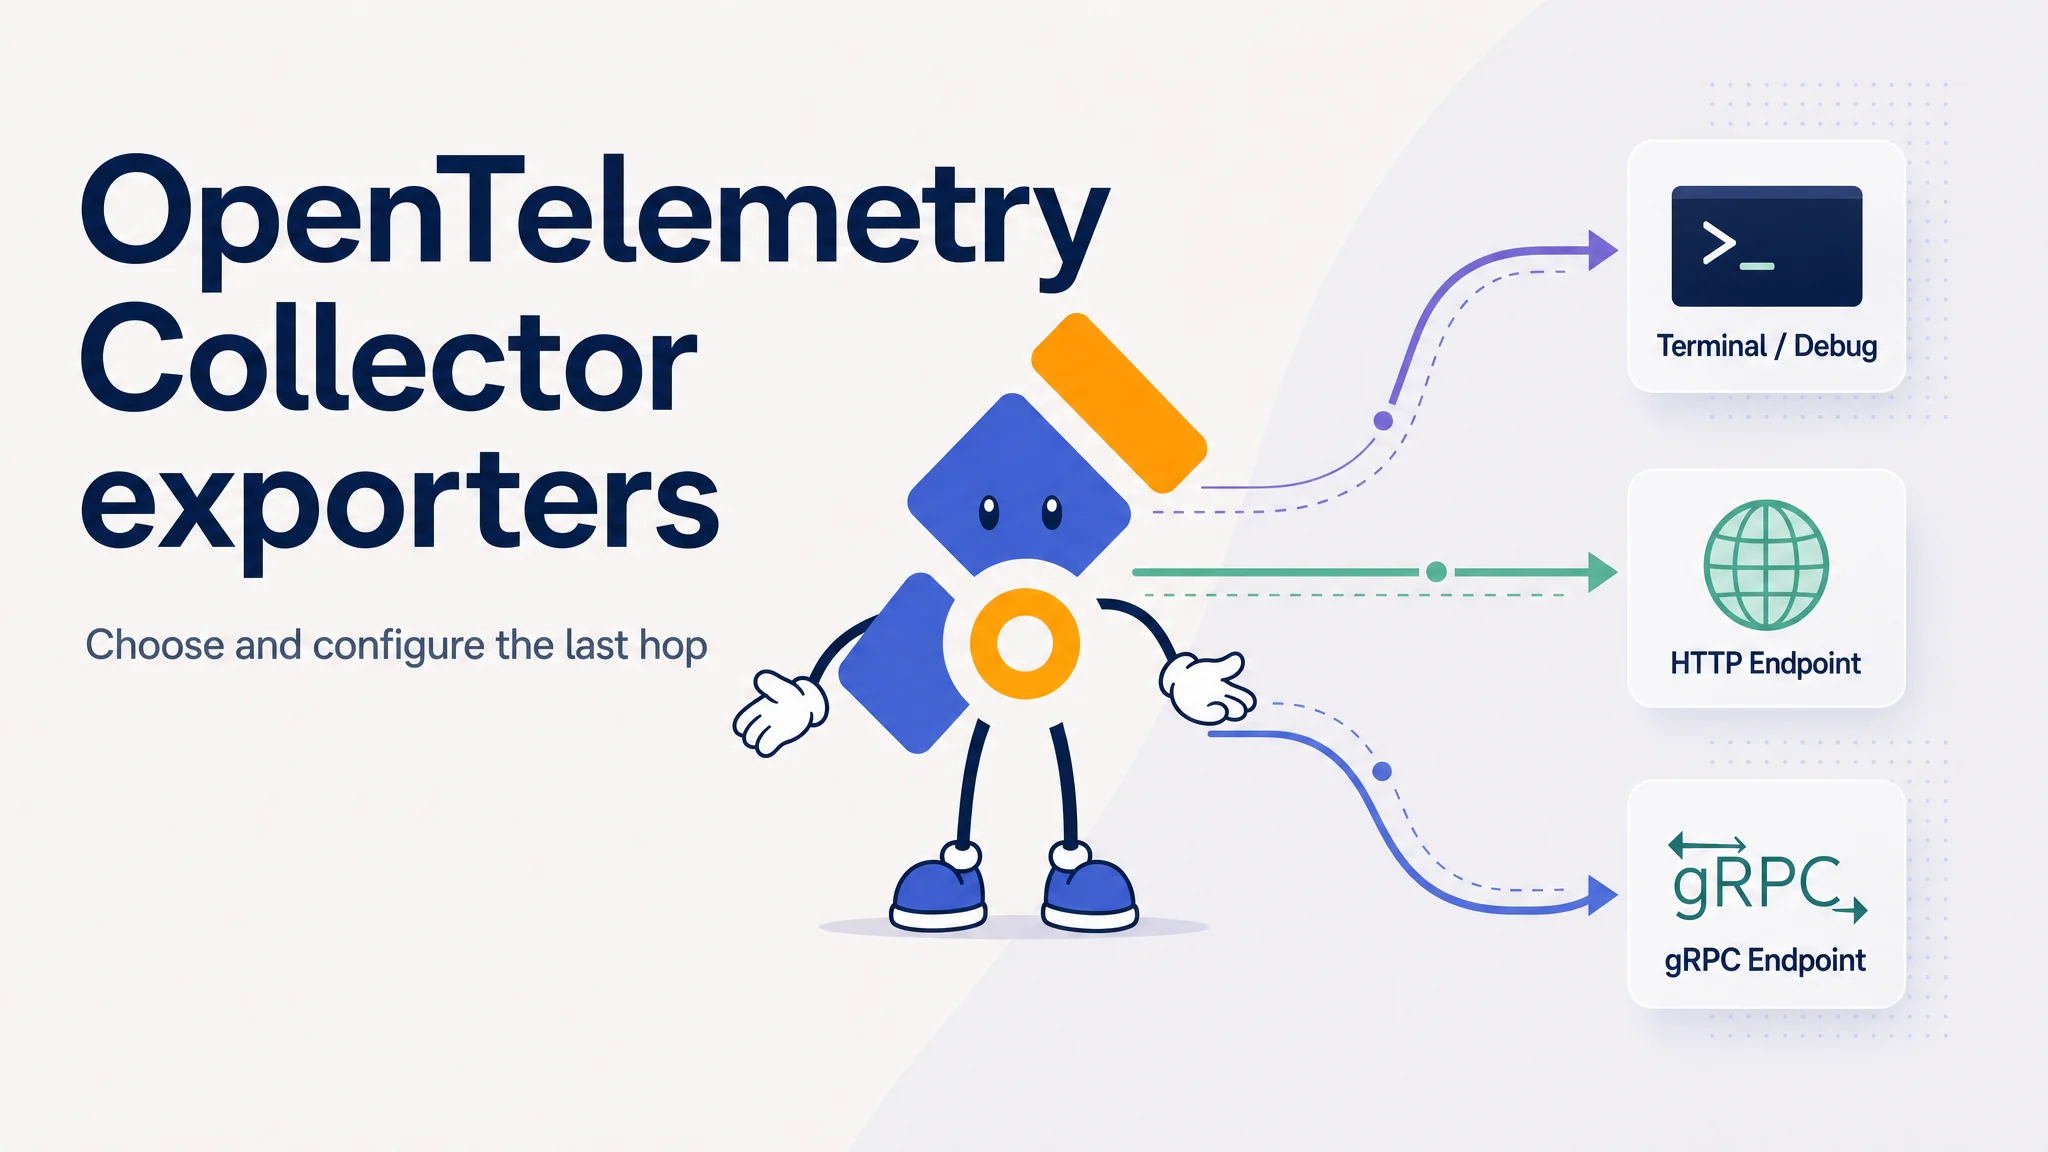
An OpenTelemetry Collector exporter sends processed telemetry from the Collector to a backend, another Collector, or a debugging destination. Common choices include the debug exporter, OTLP over HTTP, and OTLP over gRPC.
The last hop often fails quietly. The application emits data, the receiver listens on the right port, and processors batch records, yet the backend stays empty because the exporter uses the wrong protocol, path, or header. This guide covers the exporter types, their configuration, and OTLP HTTP export to Parseable.
Where exporters sit in the Collector
Most Collector pipelines are easiest to understand as three active stages:
receiver -> processor(s) -> exporter(s)A receiver gets telemetry into the Collector. A processor can batch, enrich, redact, filter, sample or otherwise change that telemetry. An exporter sends the result out. The top-level exporters section defines exporter instances, but those instances are just named pieces of config until a pipeline refers to them under service.pipelines. This is a small detail, but it explains a lot of confusing first-time Collector behavior.
receivers:
  otlp:
    protocols:
      grpc:
        endpoint: 0.0.0.0:4317
      http:
        endpoint: 0.0.0.0:4318

processors:
  batch:

exporters:
  debug:
    verbosity: basic

service:
  pipelines:
    traces:
      receivers: [otlp]
      processors: [batch]
      exporters: [debug]
In this small pipeline, applications send OTLP data to the Collector. The Collector batches traces and sends them to the debug exporter. The exporter then prints a short summary to the Collector logs. If you define an exporter and forget to attach it to a pipeline, nothing will use it. The Collector will not magically discover your intent. It only runs the pipeline you describe.
The Collector configuration guide covers the complete YAML structure. For exporters, two naming details matter:
- The part before
/is the exporter type, such asdebugorotlp_http. - The part after
/is your chosen instance name, such asparseable_logsorsecondary_backend.
In practice, otlp_http/parseable_logs means the Collector should use the otlp_http exporter type and call this instance parseable_logs. Instance names let one Collector use the same exporter type more than once. That becomes useful quickly because logs, metrics and traces often need different endpoints, headers, streams, retention rules or access patterns.
exporters:
  otlp_http/parseable_logs:
    logs_endpoint: ${env:PARSEABLE_URL}/v1/logs
    encoding: proto
    headers:
      Authorization: Bearer ${env:PARSEABLE_API_KEY}
      X-P-Stream: app_logs
      Content-Type: application/x-protobuf

  otlp_http/parseable_traces:
    traces_endpoint: ${env:PARSEABLE_URL}/v1/traces
    encoding: proto
    headers:
      Authorization: Bearer ${env:PARSEABLE_API_KEY}
      X-P-Stream: app_traces
      Content-Type: application/x-protobuf
Both exporters above use the same component type, but they can carry different signal endpoints, headers, timeouts or queues. This is one of the nicer parts of the Collector model. You can keep the pipeline shape consistent while still making each exporter instance specific enough for the backend it is talking to.
OpenTelemetry Collector vs exporter
The Collector is the executable service that runs receivers, processors, exporters, connectors, and extensions. An exporter is one component inside that service. It handles the outbound connection after the rest of the pipeline has accepted and processed telemetry.
Language SDKs also have exporters. An SDK exporter runs inside an application and can send telemetry directly to a backend or Collector. A Collector exporter runs inside the Collector. This article covers Collector exporters; the OTLP guide explains the protocol shared by both paths.
What the official exporter package contains
The official OpenTelemetry Collector exporter package contains the exporter contract, shared helper code, test utilities, and three general-purpose exporter implementations. The broader exporter catalog lists components included across core, contrib, Kubernetes, and other Collector distributions. Package contents and distribution contents are related, but they are not the same list.
At the time of writing, the user-facing exporters in that package are:
| Exporter | Current component type | What it does | Usual use |
|---|---|---|---|
| Debug exporter | debug | Writes telemetry summaries or details to Collector output | Proving a pipeline receives data before adding a backend |
| OTLP gRPC exporter | otlp_grpc | Sends OpenTelemetry data over OTLP/gRPC | Collector-to-Collector hops and gRPC-capable OTLP backends |
| OTLP HTTP exporter | otlp_http | Sends OpenTelemetry data over OTLP/HTTP | Backends and networks where HTTP is easier to operate |
You may still see older configurations using otlp for the gRPC exporter and otlphttp for the HTTP exporter. Current upstream documentation marks them as deprecated aliases for otlp_grpc and otlp_http. Check the Collector version before renaming an existing production configuration. Other folders in the package provide shared helpers, tests, no-op implementations, and experimental APIs rather than ordinary production destinations.
The debug exporter
The debug exporter removes the backend from the problem. When telemetry does not appear, the failure could be anywhere:
- the application is not emitting
- the SDK endpoint points somewhere else
- the Collector receiver is not listening on the expected port
- a processor drops or transforms the data
- the exporter cannot authenticate with the backend
- the backend rejects the request
The debug exporter answers one question cleanly. Did data reach this point in the pipeline? If the answer is yes, you can stop arguing with the receiver and start looking at export. If the answer is no, backend credentials are not your first problem.
exporters:
  debug:
    verbosity: normal

service:
  pipelines:
    logs:
      receivers: [otlp]
      processors: [batch]
      exporters: [debug]
With verbosity: basic, the exporter logs a short count. normal prints roughly one line per record, and detailed includes much more of the payload. Detailed output can expose request paths, identifiers, SQL statements, headers, or log bodies. Use the exporter to prove the path, then remove it from a busy production pipeline.
The OTLP gRPC exporter
The OTLP gRPC exporter sends logs, metrics and traces using OTLP over gRPC. It fits Collector-to-Collector traffic and backends reached through a network path that supports HTTP/2 and gRPC cleanly. A simple hop looks like this:
exporters:
  otlp_grpc/gateway:
    endpoint: gateway-collector:4317
    tls:
      insecure: true
    retry_on_failure:
      enabled: true
    sending_queue:
      enabled: true

service:
  pipelines:
    traces:
      receivers: [otlp]
      processors: [batch]
      exporters: [otlp_grpc/gateway]
Use TLS for real networks. The insecure: true example is only for local or trusted test environments where you are intentionally using plaintext. The gRPC exporter keeps the OpenTelemetry data model intact and avoids vendor-specific translation at the pipeline boundary. That is the main reason to like it. Your application emits OpenTelemetry, the first Collector receives OpenTelemetry, and the next Collector receives OpenTelemetry too.
If both transports are available, test them through the same load balancer, proxy, and firewall path used in production. Throughput depends on payload size, compression, latency, queue settings, and backend behavior.
The OTLP HTTP exporter
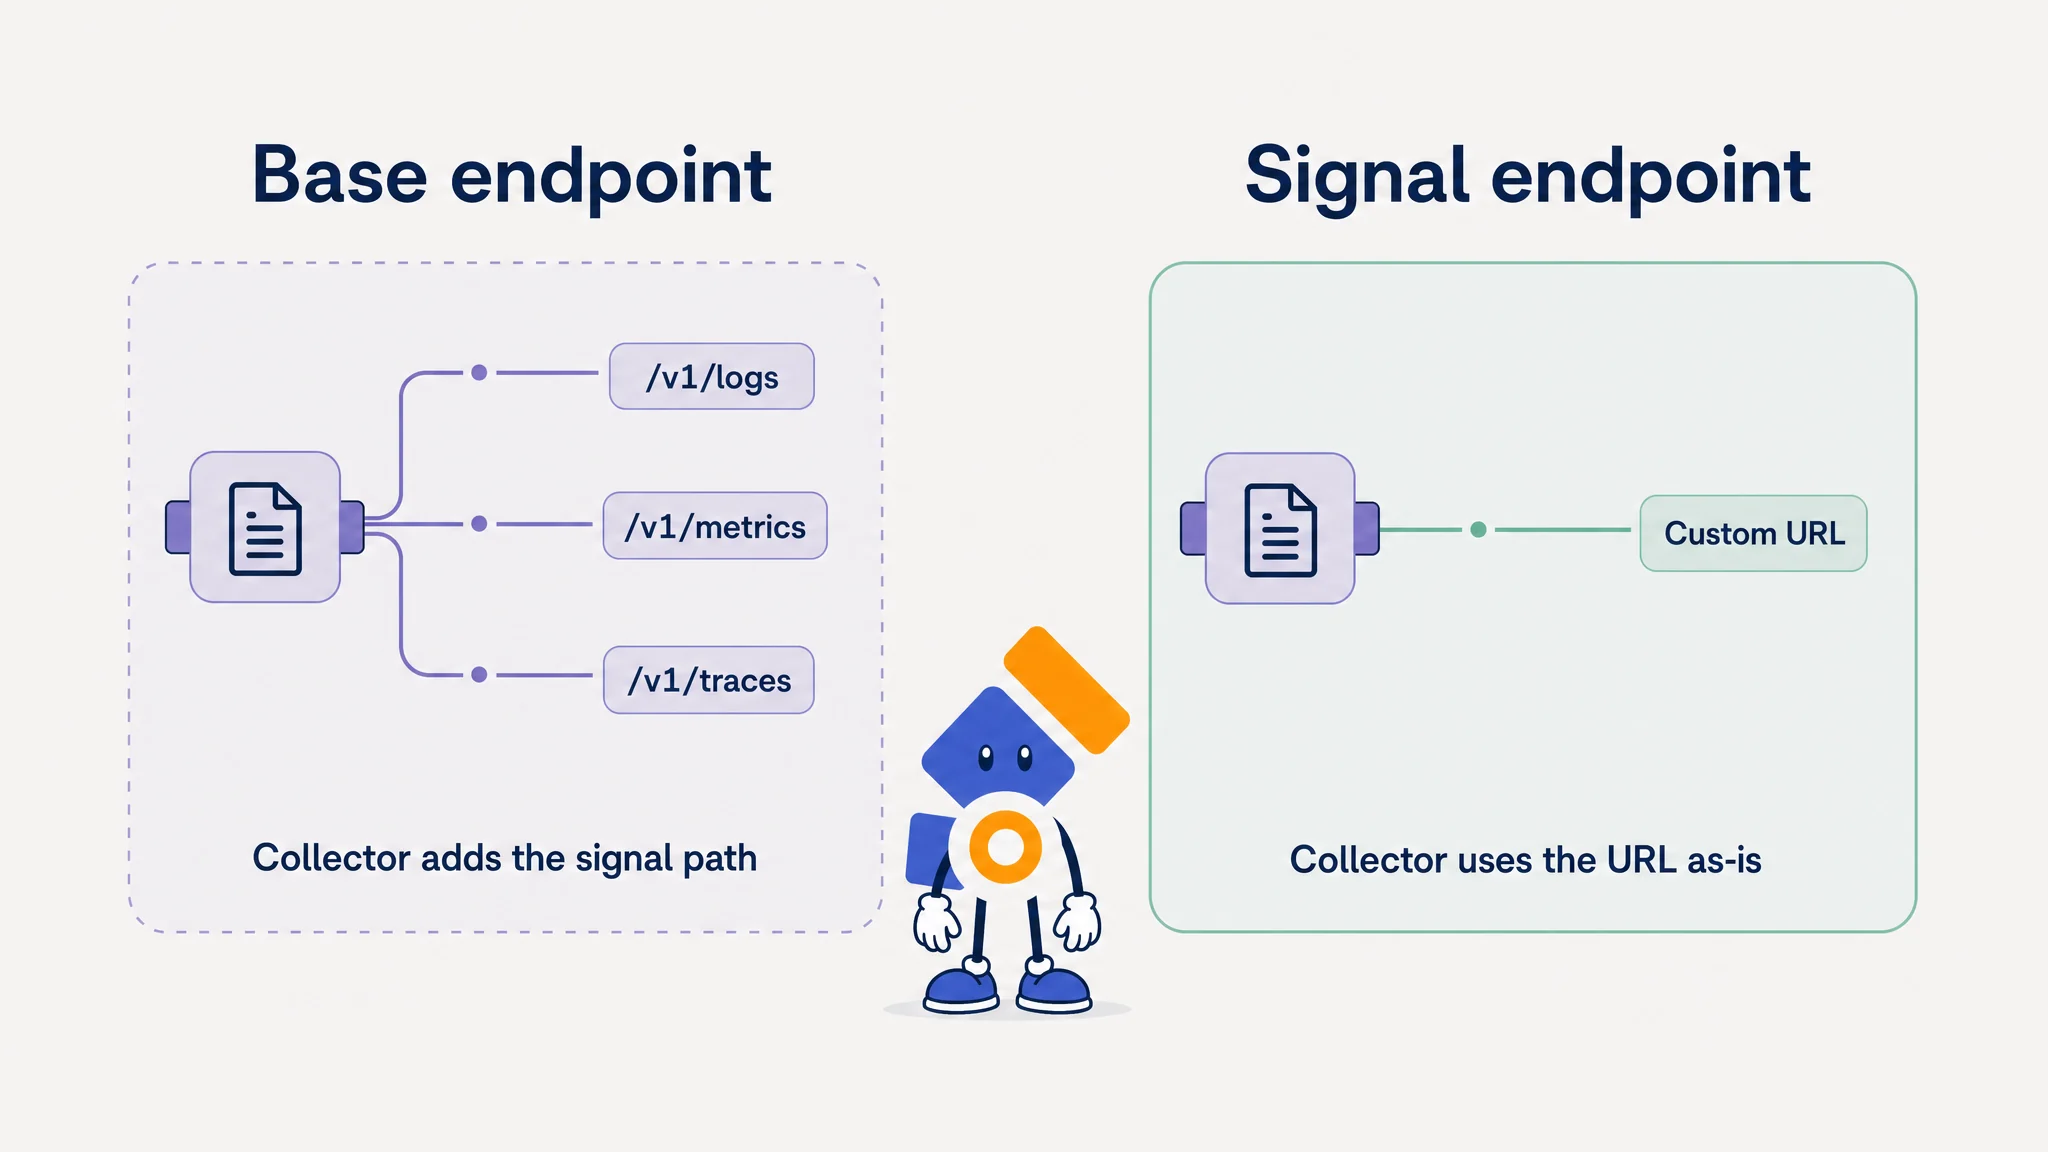
The OTLP HTTP exporter sends the same OpenTelemetry data model using HTTP. It often works more easily with hosted backends, corporate proxies, and common load balancers. The OTLP HTTP exporter treats endpoint as a base URL and appends the signal path:
- traces go to
/v1/traces - metrics go to
/v1/metrics - logs go to
/v1/logs
With only the base endpoint, a config like this:
exporters:
  otlp_http/backend:
    endpoint: https://otel-backend.example.com
sends traces to https://otel-backend.example.com/v1/traces, metrics to https://otel-backend.example.com/v1/metrics, and logs to https://otel-backend.example.com/v1/logs. If your backend gives you separate URLs, use signal-specific endpoints instead. This is usually the difference between a clean first request and a confusing 404.
exporters:
  otlp_http/backend_traces:
    traces_endpoint: https://otel-backend.example.com/custom/traces
    headers:
      Authorization: Bearer ${env:OTLP_TOKEN}
When traces_endpoint, metrics_endpoint or logs_endpoint is present, that value replaces the base endpoint for the matching signal. Putting a full /v1/traces URL in the base endpoint can produce a duplicated path.
Exporters are not processors
An exporter should not be treated as one more transformation step. Processors change data before export. Exporters deliver the already processed data to a destination. That means redaction, attribute cleanup, filtering, sampling and batching should happen before the exporter runs. This boundary keeps the pipeline understandable. It also keeps security decisions in one place instead of scattering them across backend-specific export paths.
good:
receiver -> redact processor -> batch processor -> exporter

bad:
receiver -> batch processor -> exporter -> hope the backend cleans it later
That boundary matters for security. If an API token, email address, or payment identifier reaches the exporter, the Collector has already attempted to send it. Apply shared preparation in processors; the PII removal guide shows where redaction belongs.
Fan-out: sending to more than one destination
A Collector pipeline can list more than one exporter:
service:
  pipelines:
    traces:
      receivers: [otlp]
      processors: [batch]
      exporters: [debug, otlp_http/parseable_traces, otlp_grpc/archive]
Fan-out helps with migrations and temporary validation. It also adds more failure paths and destinations for sensitive data.
- Each exporter has its own credentials.
- Each exporter has its own queue and retry behavior.
- One backend may be slow while another is healthy.
- Sending to two backends can double egress and ingest cost.
- Sensitive data is now leaving through two paths, not one.
If two backends must receive the same signal permanently, document that decision and monitor both export paths.
Reliability settings that belong near exporters
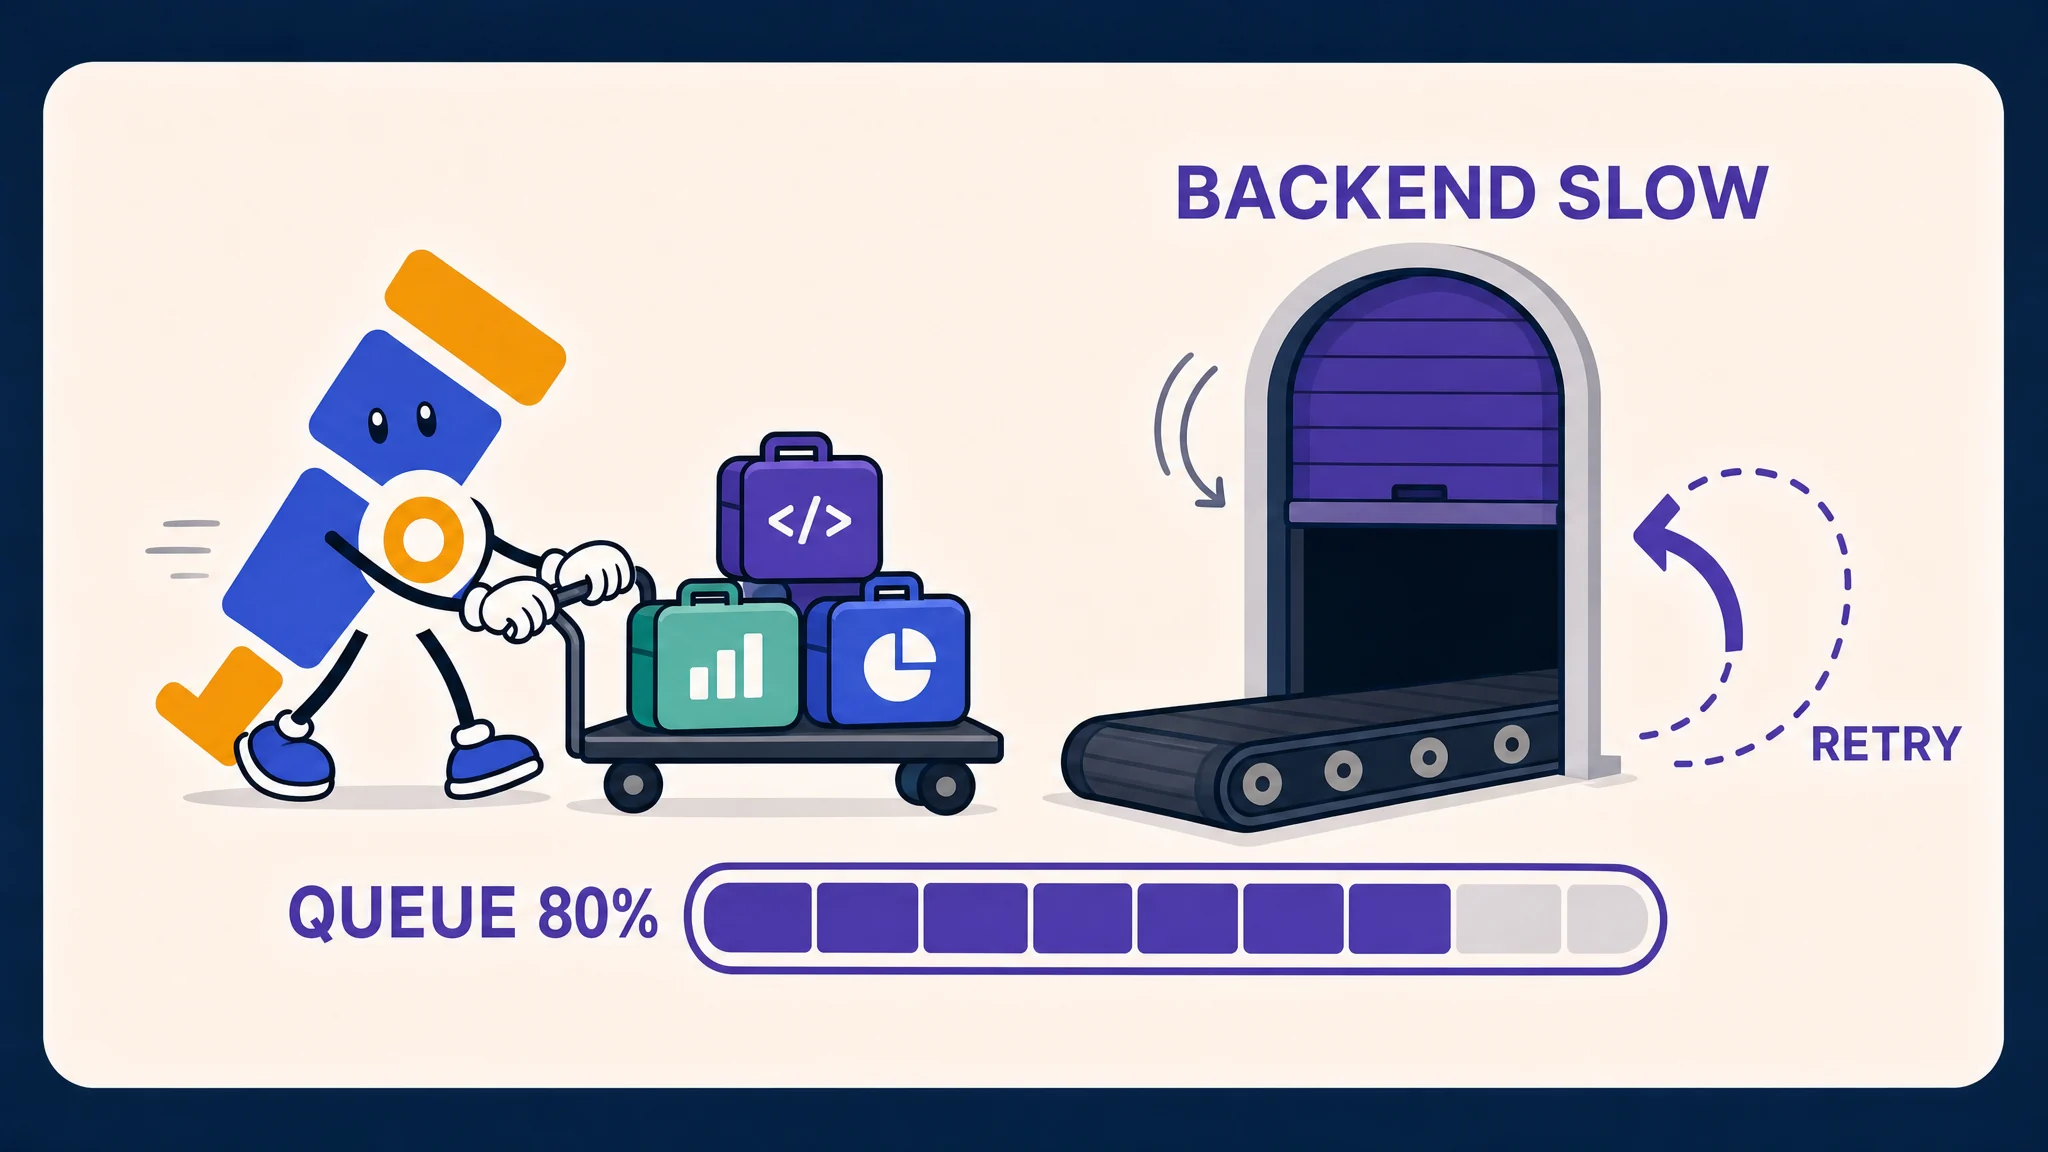
Exporters are where backpressure becomes visible. If the backend is slow or unavailable, the Collector has only a few choices. It can wait, retry, queue, reject new data or drop data. The exact behavior depends on exporter settings and the pressure on the Collector process. This is why exporter config deserves more attention than just an endpoint and a token. Start with these settings:
exporters:
  otlp_http/backend:
    endpoint: ${env:OTLP_ENDPOINT}
    timeout: 30s
    retry_on_failure:
      enabled: true
      initial_interval: 5s
      max_interval: 30s
      max_elapsed_time: 300s
    sending_queue:
      enabled: true
      queue_size: 1000
      num_consumers: 10
timeout controls how long an individual send attempt can take. retry_on_failure controls retry behavior for temporary failures. A retry cannot fix bad credentials, malformed data or a permanently wrong endpoint. It is for cases where the destination is temporarily overloaded, restarting or unreachable. sending_queue gives the exporter room to absorb short backend stalls. When the queue fills, new data can be rejected or dropped depending on configuration. A queue is not free storage. It uses memory by default, and a larger queue can keep data alive longer while also increasing Collector memory pressure.
For stronger durability, the Collector can use a persistent queue with a storage extension. This can preserve queued data across restarts, but it adds disk capacity and performance requirements. The memory limiter guide explains how queue growth affects Collector memory. Keep the batch processor and exporter queue separate:
batch processor -> exporter sending queue -> export attempt -> backendThe batch processor groups telemetry into requests. The exporter queue holds completed requests while the destination is slow.
Protocol, endpoint and authentication checks
Most exporter problems come down to small mismatches. The frustrating part is that all of them can look the same from the outside. The backend is empty, the app team says it is emitting, and the Collector appears to be running. Use this checklist before changing three things at once:
| Check | What to confirm |
|---|---|
| Transport | The exporter uses the protocol the backend endpoint accepts: OTLP/HTTP or OTLP/gRPC |
| Port | 4317 is the common OTLP/gRPC default, 4318 is the common OTLP/HTTP default |
| Path | OTLP/HTTP uses /v1/traces, /v1/metrics and /v1/logs |
| Auth | Headers are present, API keys are valid, and environment variables expand inside the Collector process |
| TLS | The URL scheme and TLS config match the endpoint |
| Signal | The pipeline sends the signal that the exporter endpoint expects |
| Queue | Queue size and failed send metrics show whether data is stuck before export |
For local debugging, replace the backend exporter with debug. If it logs records, inspect the remote endpoint and exporter. If it stays silent, inspect the application-to-Collector path. The Collector metrics guide covers queue utilization, failed sends, and refused telemetry.
Exporting OpenTelemetry data to Parseable
Parseable accepts OpenTelemetry logs, metrics and traces over OTLP/HTTP. No Parseable-specific Collector exporter is required. OTLP carries each signal to its matching endpoint. Here is a compact three-signal configuration:
receivers:
  otlp:
    protocols:
      grpc:
        endpoint: 0.0.0.0:4317
      http:
        endpoint: 0.0.0.0:4318

processors:
  memory_limiter:
    check_interval: 1s
    limit_mib: 512
    spike_limit_mib: 128

  batch:
    timeout: 1s
    send_batch_size: 1024

exporters:
  otlp_http/parseable_logs:
    logs_endpoint: ${env:PARSEABLE_URL}/v1/logs
    encoding: proto
    headers:
      Authorization: Bearer ${env:PARSEABLE_API_KEY}
      X-P-Stream: app_logs
      Content-Type: application/x-protobuf
    retry_on_failure:
      enabled: true
    sending_queue:
      enabled: true

  otlp_http/parseable_metrics:
    metrics_endpoint: ${env:PARSEABLE_URL}/v1/metrics
    encoding: proto
    headers:
      Authorization: Bearer ${env:PARSEABLE_API_KEY}
      X-P-Stream: app_metrics
      Content-Type: application/x-protobuf
    retry_on_failure:
      enabled: true
    sending_queue:
      enabled: true

  otlp_http/parseable_traces:
    traces_endpoint: ${env:PARSEABLE_URL}/v1/traces
    encoding: proto
    headers:
      Authorization: Bearer ${env:PARSEABLE_API_KEY}
      X-P-Stream: app_traces
      Content-Type: application/x-protobuf
    retry_on_failure:
      enabled: true
    sending_queue:
      enabled: true

service:
  pipelines:
    logs:
      receivers: [otlp]
      processors: [memory_limiter, batch]
      exporters: [otlp_http/parseable_logs]

    metrics:
      receivers: [otlp]
      processors: [memory_limiter, batch]
      exporters: [otlp_http/parseable_metrics]

    traces:
      receivers: [otlp]
      processors: [memory_limiter, batch]
      exporters: [otlp_http/parseable_traces]
Use PARSEABLE_URL without a trailing slash, such as https://example.parseable.com or http://parseable:8000. Set PARSEABLE_API_KEY to an API key with ingest access. X-P-Stream selects the destination dataset. Separate exporter instances let each signal use its own dataset, retention, and access rules. The current Parseable ingestion documentation describes the OTLP endpoints and headers. During setup, keep a temporary debug exporter beside the Parseable exporter:
service:
  pipelines:
    traces:
      receivers: [otlp]
      processors: [memory_limiter, batch]
      exporters: [debug, otlp_http/parseable_traces]
Once records appear in Collector output and Parseable, remove debug from the production pipeline.
Official Collector exporters vs contrib exporters
The official Collector exporter package covers debug output and OTLP export. That is enough when the destination accepts OTLP.
The wider OpenTelemetry Collector Contrib exporter directory contains many more exporters. You will find exporters for cloud providers, queues, storage systems, vendor backends and other protocols. Examples include AWS, Azure, Google Cloud, Kafka, ClickHouse, Elasticsearch, OpenSearch, Prometheus remote write, Sentry, Splunk HEC, Zipkin and others.
Contrib exporters cover a wider range of destinations and can change at a different pace. Check the component's supported signals, stability, and presence in your chosen distribution. Prefer OTLP when the destination supports it; use a contrib exporter when the destination requires another protocol or exposes needed features only through its native integration.
Picking the right exporter
Use debug first when you are building or troubleshooting because it proves the Collector is receiving and processing data. Use otlp_http when the backend supports OTLP/HTTP, especially across hosted endpoints, HTTP proxies, common ingress controllers or environments where gRPC is harder to operate. It is also a good default for Parseable ingestion. Use otlp_grpc when both sides support OTLP/gRPC and your network path handles it cleanly. It is common for Collector-to-Collector traffic and backend endpoints designed around gRPC. Use a contrib exporter when the destination does not accept OTLP or when it has a mature native ingestion protocol you need. Prometheus remote write, Kafka and cloud-provider destinations are common examples.
Use this decision table before tuning the exporter:
| Destination or task | Start with | Check first |
|---|---|---|
| Prove that data reaches the pipeline | debug | Output verbosity and sensitive fields |
| Hosted OTLP endpoint | otlp_http | Base URL, signal paths, headers, and TLS |
| Collector-to-Collector hop | otlp_grpc | HTTP/2 support, TLS, and load balancing |
| Backend with no OTLP endpoint | Matching contrib exporter | Supported signals, stability, and distribution |
| Parallel migration | Two exporters temporarily | Cost, credentials, queues, and removal date |
Then answer these questions:
- Which signal is being sent: logs, metrics, traces or profiles?
- Does the destination accept OTLP, or does it need a vendor-specific protocol?
- Is the endpoint a base URL or a full signal-specific URL?
- Which headers or credentials does the backend expect?
- What happens when the backend is slow for five minutes?
- How much data can the Collector safely queue?
- Which internal metrics will alert you before data starts dropping?
The answers define the destination, failure behavior, and operating limits of the last hop.
Final thoughts
Prove the pipeline with debug, then use OTLP when the destination supports it. Keep redaction and batching in processors, bound exporter queues, and monitor failed sends. Parseable accepts OTLP HTTP directly, so applications can remain independent of the storage backend.